

Key Insights
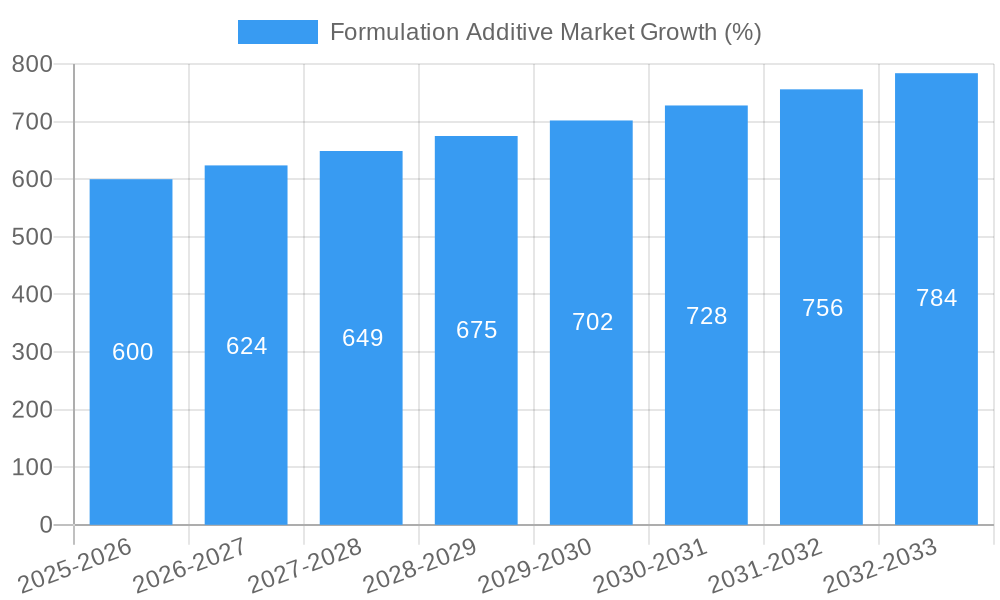
The Formulation Additives market is experiencing robust growth, projected to maintain a CAGR exceeding 4% from 2025 to 2033. This expansion is driven by several key factors. Firstly, the increasing demand across diverse end-user industries, including construction (driven by infrastructure development), automotive (fueled by lightweighting and performance enhancement needs), and oil and gas (necessitated by improved efficiency and durability), significantly contributes to market growth. Furthermore, evolving consumer preferences for high-performance materials and stringent regulatory compliance regarding product safety and environmental impact are pushing innovation and adoption of advanced formulation additives. The market segmentation, encompassing defoamers, rheology modifiers, dispersing agents, etc., reflects the diverse applications and specialized functionalities these additives provide. Major players like Honeywell, Arkema, and BASF are actively engaged in R&D and strategic acquisitions, further intensifying market competition and driving innovation.
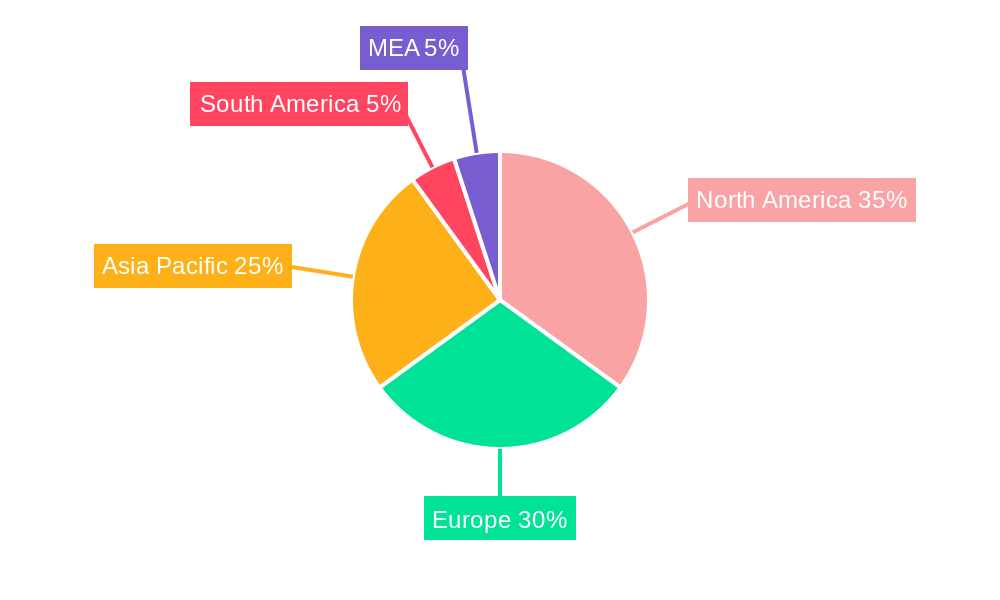
The geographical distribution of the market showcases strong growth potential across various regions. North America and Europe, currently holding substantial market shares, continue to exhibit steady growth, driven by established industries and robust research infrastructure. However, the Asia-Pacific region is expected to witness the fastest growth, fueled by rapid industrialization, particularly in countries like China and India. This growth trajectory will be further influenced by factors such as rising disposable incomes, increasing infrastructure projects, and burgeoning automotive industries in these regions. While challenges like fluctuating raw material prices and stringent environmental regulations might pose certain restraints, the overall market outlook remains positive, driven by the inherent necessity of formulation additives in various industries and the continuous efforts toward product innovation.
Formulation Additive Market: A Comprehensive Report (2019-2033)
This insightful report provides a detailed analysis of the Formulation Additive Market, offering a comprehensive overview of market trends, key players, and future growth prospects. Covering the period from 2019 to 2033, with a base year of 2025 and a forecast period spanning 2025-2033, this report is an indispensable resource for stakeholders seeking to understand and capitalize on opportunities within this dynamic sector. The market is estimated to be worth xx Million in 2025 and is projected to reach xx Million by 2033, exhibiting a robust CAGR of xx%.
Formulation Additive Market Composition & Trends
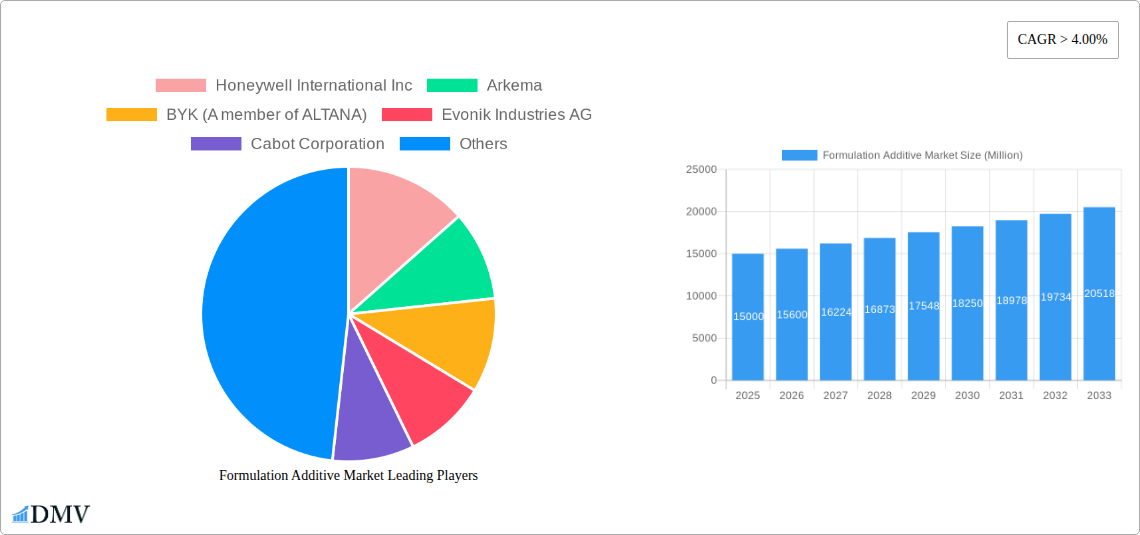
This section delves into the competitive landscape of the Formulation Additive Market, analyzing market concentration, innovation drivers, regulatory hurdles, substitute products, end-user preferences, and mergers & acquisitions (M&A) activities. The market exhibits a moderately concentrated structure, with key players like Honeywell International Inc, Arkema, BYK (A member of ALTANA), and BASF SE holding significant market share. However, the presence of numerous smaller players contributes to a dynamic competitive environment.
- Market Share Distribution: Honeywell International Inc holds an estimated xx% market share in 2025, followed by Arkema at xx%, BASF SE at xx%, and BYK at xx%. The remaining share is distributed among other key players and smaller participants.
- Innovation Catalysts: Stringent environmental regulations and the increasing demand for high-performance materials are driving innovation in sustainable and efficient formulation additives.
- Regulatory Landscape: Regional variations in environmental regulations, such as those related to VOC emissions and hazardous substances, significantly impact product development and market access.
- Substitute Products: The availability of bio-based and recycled alternatives poses a challenge to traditional formulation additives.
- End-User Profiles: The market is diverse, with significant demand from the construction, automotive, and oil and gas sectors. The preference for high-performance, cost-effective, and sustainable additives is shaping end-user choices.
- M&A Activities: The past five years have witnessed several notable M&A deals, with aggregate deal values exceeding xx Million. These transactions reflect strategic efforts to expand product portfolios, enhance geographic reach, and consolidate market share. For example, the acquisition of X by Y in 2023 for xx Million broadened Y's portfolio in the rheology modifier segment.
Formulation Additive Market Industry Evolution
This section examines the historical and projected growth trajectories of the Formulation Additive Market. Technological advancements such as nanotechnology and bio-based additives are reshaping the industry landscape. Furthermore, shifting consumer preferences toward eco-friendly and sustainable products are influencing market dynamics. The market witnessed a growth rate of xx% from 2019 to 2024, driven by increased demand from the construction and automotive sectors. Technological advancements, such as the introduction of self-healing polymers and advanced rheology modifiers, have enhanced product performance and broadened application areas. Adoption of these advanced additives is growing steadily, with an estimated xx% of new construction projects incorporating them in 2025. The increasing focus on sustainable solutions further fuels market growth, particularly in regions with stringent environmental policies.
Leading Regions, Countries, or Segments in Formulation Additive Market
This section identifies the leading regions, countries, and segments within the Formulation Additive Market.
Dominant Region: North America currently holds the largest market share, driven by robust construction activity and a strong automotive sector. Europe follows closely, with a significant contribution from the chemical industry. Asia-Pacific is expected to experience the highest growth rate during the forecast period.
Dominant Segments:
- By Type: The deflocculants segment currently holds a significant market share, driven by high demand from the construction and oil and gas industries. However, the rheology modifier segment is anticipated to witness the fastest growth over the forecast period, due to its increasing applications in advanced materials.
- By End-user Industry: The automotive industry is a major consumer of formulation additives, owing to its demand for high-performance coatings, adhesives, and sealants. The construction sector also displays high demand, driven by the growth in infrastructure development projects and the need for durable and sustainable building materials.
Key Drivers:
- North America: Strong government investments in infrastructure projects, coupled with a flourishing automotive industry, are key drivers for market growth.
- Europe: The stringent environmental regulations pushing for sustainable additives are promoting innovation and accelerating market expansion.
- Asia-Pacific: Rapid industrialization and urbanization, along with increasing disposable incomes, are fueling significant demand for formulation additives.
Formulation Additive Market Product Innovations
Recent innovations include bio-based defloamers that minimize environmental impact, self-healing polymers that enhance product durability, and advanced rheology modifiers that improve process efficiency. These advancements enhance product performance, reduce costs, and meet increasing environmental concerns, driving market expansion and competitiveness.
Propelling Factors for Formulation Additive Market Growth
Technological advancements, particularly in nanotechnology and bio-based materials, are key growth drivers. The rising demand for high-performance and sustainable products across diverse industries, coupled with supportive government regulations promoting eco-friendly solutions, significantly contributes to market expansion. Economic growth, particularly in developing economies, further stimulates demand.
Obstacles in the Formulation Additive Market
Regulatory challenges related to the use of certain chemicals, supply chain disruptions caused by geopolitical events, and intense competition from both established and emerging players pose significant hurdles to market growth. Fluctuations in raw material prices and the complexity of product development and regulatory compliance also impede market expansion.
Future Opportunities in Formulation Additive Market
Emerging opportunities lie in developing innovative bio-based additives, expanding into new markets like renewable energy and 3D printing, and meeting the increasing demand for customized solutions tailored to specific end-user needs. The rising adoption of sustainable practices across industries presents lucrative opportunities for eco-friendly formulation additives.
Major Players in the Formulation Additive Market Ecosystem
- Honeywell International Inc
- Arkema
- BYK (A member of ALTANA)
- Evonik Industries AG
- Cabot Corporation
- LANXESS
- Momentive
- BASF SE
- Huntsman International LLC
- Dow
- Eastman Chemical Company
- MÜNZING Corporation
Key Developments in Formulation Additive Market Industry
- 2023 (Q3): BASF SE launched a new range of bio-based rheology modifiers.
- 2022 (Q4): Arkema acquired a smaller additive manufacturer, expanding its product portfolio in the deflocculants segment.
- 2021 (Q1): New regulations on VOC emissions in Europe impacted the market for certain types of formulation additives.
- (Further developments can be added here as they become available)
Strategic Formulation Additive Market Market Forecast
The Formulation Additive Market is poised for robust growth, driven by technological innovation, increasing demand for high-performance and sustainable products, and expanding application areas. The market is expected to witness significant expansion across key regions, particularly in Asia-Pacific, owing to rapid industrialization and urbanization. The adoption of sustainable and bio-based additives is also predicted to gain traction, significantly shaping the future trajectory of the market.
Formulation Additive Market Segmentation
-
1. Type
- 1.1. Defoamers
- 1.2. Rheology
- 1.3. Modifier
- 1.4. Dispersing Agents
-
2. End-user Industry
- 2.1. Construction
- 2.2. Transportation
- 2.3. Automotive
- 2.4. Oil and Gas
- 2.5. Food and Beverage
- 2.6. Electronics
- 2.7. Other End-user Industries
Formulation Additive Market Segmentation By Geography
-
1. Asia Pacific
- 1.1. China
- 1.2. India
- 1.3. Japan
- 1.4. South Korea
- 1.5. Rest of Asia Pacific
-
2. North America
- 2.1. United States
- 2.2. Canada
- 2.3. Mexico
-
3. Europe
- 3.1. Germany
- 3.2. United Kingdom
- 3.3. France
- 3.4. Italy
- 3.5. Rest of Europe
-
4. South America
- 4.1. Brazil
- 4.2. Argentina
- 4.3. Rest of South America
-
5. Middle East and Africa
- 5.1. Saudi Arabia
- 5.2. South Africa
- 5.3. Rest of Middle East and Africa
Formulation Additive Market REPORT HIGHLIGHTS
| Aspects | Details |
|---|---|
| Study Period | 2019-2033 |
| Base Year | 2024 |
| Estimated Year | 2025 |
| Forecast Period | 2025-2033 |
| Historical Period | 2019-2024 |
| Growth Rate | CAGR of > 4.00% from 2019-2033 |
| Segmentation |
|
Table of Contents
- 1. Introduction
- 1.1. Research Scope
- 1.2. Market Segmentation
- 1.3. Research Methodology
- 1.4. Definitions and Assumptions
- 2. Executive Summary
- 2.1. Introduction
- 3. Market Dynamics
- 3.1. Introduction
- 3.2. Market Drivers
- 3.2.1. ; Increase Demand from Construction and Transportation Industries; Other Drivers
- 3.3. Market Restrains
- 3.3.1. ; Fluctuating Raw Material Prices; Unfavorable Conditions Arising Due to COVID-19
- 3.4. Market Trends
- 3.4.1. Construction Sector to Dominate the Market
- 4. Market Factor Analysis
- 4.1. Porters Five Forces
- 4.2. Supply/Value Chain
- 4.3. PESTEL analysis
- 4.4. Market Entropy
- 4.5. Patent/Trademark Analysis
- 5. Global Formulation Additive Market Analysis, Insights and Forecast, 2019-2031
- 5.1. Market Analysis, Insights and Forecast - by Type
- 5.1.1. Defoamers
- 5.1.2. Rheology
- 5.1.3. Modifier
- 5.1.4. Dispersing Agents
- 5.2. Market Analysis, Insights and Forecast - by End-user Industry
- 5.2.1. Construction
- 5.2.2. Transportation
- 5.2.3. Automotive
- 5.2.4. Oil and Gas
- 5.2.5. Food and Beverage
- 5.2.6. Electronics
- 5.2.7. Other End-user Industries
- 5.3. Market Analysis, Insights and Forecast - by Region
- 5.3.1. Asia Pacific
- 5.3.2. North America
- 5.3.3. Europe
- 5.3.4. South America
- 5.3.5. Middle East and Africa
- 5.1. Market Analysis, Insights and Forecast - by Type
- 6. Asia Pacific Formulation Additive Market Analysis, Insights and Forecast, 2019-2031
- 6.1. Market Analysis, Insights and Forecast - by Type
- 6.1.1. Defoamers
- 6.1.2. Rheology
- 6.1.3. Modifier
- 6.1.4. Dispersing Agents
- 6.2. Market Analysis, Insights and Forecast - by End-user Industry
- 6.2.1. Construction
- 6.2.2. Transportation
- 6.2.3. Automotive
- 6.2.4. Oil and Gas
- 6.2.5. Food and Beverage
- 6.2.6. Electronics
- 6.2.7. Other End-user Industries
- 6.1. Market Analysis, Insights and Forecast - by Type
- 7. North America Formulation Additive Market Analysis, Insights and Forecast, 2019-2031
- 7.1. Market Analysis, Insights and Forecast - by Type
- 7.1.1. Defoamers
- 7.1.2. Rheology
- 7.1.3. Modifier
- 7.1.4. Dispersing Agents
- 7.2. Market Analysis, Insights and Forecast - by End-user Industry
- 7.2.1. Construction
- 7.2.2. Transportation
- 7.2.3. Automotive
- 7.2.4. Oil and Gas
- 7.2.5. Food and Beverage
- 7.2.6. Electronics
- 7.2.7. Other End-user Industries
- 7.1. Market Analysis, Insights and Forecast - by Type
- 8. Europe Formulation Additive Market Analysis, Insights and Forecast, 2019-2031
- 8.1. Market Analysis, Insights and Forecast - by Type
- 8.1.1. Defoamers
- 8.1.2. Rheology
- 8.1.3. Modifier
- 8.1.4. Dispersing Agents
- 8.2. Market Analysis, Insights and Forecast - by End-user Industry
- 8.2.1. Construction
- 8.2.2. Transportation
- 8.2.3. Automotive
- 8.2.4. Oil and Gas
- 8.2.5. Food and Beverage
- 8.2.6. Electronics
- 8.2.7. Other End-user Industries
- 8.1. Market Analysis, Insights and Forecast - by Type
- 9. South America Formulation Additive Market Analysis, Insights and Forecast, 2019-2031
- 9.1. Market Analysis, Insights and Forecast - by Type
- 9.1.1. Defoamers
- 9.1.2. Rheology
- 9.1.3. Modifier
- 9.1.4. Dispersing Agents
- 9.2. Market Analysis, Insights and Forecast - by End-user Industry
- 9.2.1. Construction
- 9.2.2. Transportation
- 9.2.3. Automotive
- 9.2.4. Oil and Gas
- 9.2.5. Food and Beverage
- 9.2.6. Electronics
- 9.2.7. Other End-user Industries
- 9.1. Market Analysis, Insights and Forecast - by Type
- 10. Middle East and Africa Formulation Additive Market Analysis, Insights and Forecast, 2019-2031
- 10.1. Market Analysis, Insights and Forecast - by Type
- 10.1.1. Defoamers
- 10.1.2. Rheology
- 10.1.3. Modifier
- 10.1.4. Dispersing Agents
- 10.2. Market Analysis, Insights and Forecast - by End-user Industry
- 10.2.1. Construction
- 10.2.2. Transportation
- 10.2.3. Automotive
- 10.2.4. Oil and Gas
- 10.2.5. Food and Beverage
- 10.2.6. Electronics
- 10.2.7. Other End-user Industries
- 10.1. Market Analysis, Insights and Forecast - by Type
- 11. North America Formulation Additive Market Analysis, Insights and Forecast, 2019-2031
- 11.1. Market Analysis, Insights and Forecast - By Country/Sub-region
- 11.1.1 United States
- 11.1.2 Canada
- 11.1.3 Mexico
- 12. Europe Formulation Additive Market Analysis, Insights and Forecast, 2019-2031
- 12.1. Market Analysis, Insights and Forecast - By Country/Sub-region
- 12.1.1 Germany
- 12.1.2 France
- 12.1.3 Italy
- 12.1.4 United Kingdom
- 12.1.5 Netherlands
- 12.1.6 Rest of Europe
- 13. Asia Pacific Formulation Additive Market Analysis, Insights and Forecast, 2019-2031
- 13.1. Market Analysis, Insights and Forecast - By Country/Sub-region
- 13.1.1 China
- 13.1.2 Japan
- 13.1.3 India
- 13.1.4 South Korea
- 13.1.5 Taiwan
- 13.1.6 Australia
- 13.1.7 Rest of Asia-Pacific
- 14. South America Formulation Additive Market Analysis, Insights and Forecast, 2019-2031
- 14.1. Market Analysis, Insights and Forecast - By Country/Sub-region
- 14.1.1 Brazil
- 14.1.2 Argentina
- 14.1.3 Rest of South America
- 15. MEA Formulation Additive Market Analysis, Insights and Forecast, 2019-2031
- 15.1. Market Analysis, Insights and Forecast - By Country/Sub-region
- 15.1.1 Middle East
- 15.1.2 Africa
- 16. Competitive Analysis
- 16.1. Global Market Share Analysis 2024
- 16.2. Company Profiles
- 16.2.1 Honeywell International Inc
- 16.2.1.1. Overview
- 16.2.1.2. Products
- 16.2.1.3. SWOT Analysis
- 16.2.1.4. Recent Developments
- 16.2.1.5. Financials (Based on Availability)
- 16.2.2 Arkema
- 16.2.2.1. Overview
- 16.2.2.2. Products
- 16.2.2.3. SWOT Analysis
- 16.2.2.4. Recent Developments
- 16.2.2.5. Financials (Based on Availability)
- 16.2.3 BYK (A member of ALTANA)
- 16.2.3.1. Overview
- 16.2.3.2. Products
- 16.2.3.3. SWOT Analysis
- 16.2.3.4. Recent Developments
- 16.2.3.5. Financials (Based on Availability)
- 16.2.4 Evonik Industries AG
- 16.2.4.1. Overview
- 16.2.4.2. Products
- 16.2.4.3. SWOT Analysis
- 16.2.4.4. Recent Developments
- 16.2.4.5. Financials (Based on Availability)
- 16.2.5 Cabot Corporation
- 16.2.5.1. Overview
- 16.2.5.2. Products
- 16.2.5.3. SWOT Analysis
- 16.2.5.4. Recent Developments
- 16.2.5.5. Financials (Based on Availability)
- 16.2.6 LANXESS
- 16.2.6.1. Overview
- 16.2.6.2. Products
- 16.2.6.3. SWOT Analysis
- 16.2.6.4. Recent Developments
- 16.2.6.5. Financials (Based on Availability)
- 16.2.7 Momentive
- 16.2.7.1. Overview
- 16.2.7.2. Products
- 16.2.7.3. SWOT Analysis
- 16.2.7.4. Recent Developments
- 16.2.7.5. Financials (Based on Availability)
- 16.2.8 BASF SE
- 16.2.8.1. Overview
- 16.2.8.2. Products
- 16.2.8.3. SWOT Analysis
- 16.2.8.4. Recent Developments
- 16.2.8.5. Financials (Based on Availability)
- 16.2.9 Huntsman International LLC
- 16.2.9.1. Overview
- 16.2.9.2. Products
- 16.2.9.3. SWOT Analysis
- 16.2.9.4. Recent Developments
- 16.2.9.5. Financials (Based on Availability)
- 16.2.10 Dow
- 16.2.10.1. Overview
- 16.2.10.2. Products
- 16.2.10.3. SWOT Analysis
- 16.2.10.4. Recent Developments
- 16.2.10.5. Financials (Based on Availability)
- 16.2.11 Eastman Chemical Company
- 16.2.11.1. Overview
- 16.2.11.2. Products
- 16.2.11.3. SWOT Analysis
- 16.2.11.4. Recent Developments
- 16.2.11.5. Financials (Based on Availability)
- 16.2.12 MÜNZING Corporation
- 16.2.12.1. Overview
- 16.2.12.2. Products
- 16.2.12.3. SWOT Analysis
- 16.2.12.4. Recent Developments
- 16.2.12.5. Financials (Based on Availability)
- 16.2.1 Honeywell International Inc
List of Figures
- Figure 1: Global Formulation Additive Market Revenue Breakdown (Million, %) by Region 2024 & 2032
- Figure 2: Global Formulation Additive Market Volume Breakdown (K Tons, %) by Region 2024 & 2032
- Figure 3: North America Formulation Additive Market Revenue (Million), by Country 2024 & 2032
- Figure 4: North America Formulation Additive Market Volume (K Tons), by Country 2024 & 2032
- Figure 5: North America Formulation Additive Market Revenue Share (%), by Country 2024 & 2032
- Figure 6: North America Formulation Additive Market Volume Share (%), by Country 2024 & 2032
- Figure 7: Europe Formulation Additive Market Revenue (Million), by Country 2024 & 2032
- Figure 8: Europe Formulation Additive Market Volume (K Tons), by Country 2024 & 2032
- Figure 9: Europe Formulation Additive Market Revenue Share (%), by Country 2024 & 2032
- Figure 10: Europe Formulation Additive Market Volume Share (%), by Country 2024 & 2032
- Figure 11: Asia Pacific Formulation Additive Market Revenue (Million), by Country 2024 & 2032
- Figure 12: Asia Pacific Formulation Additive Market Volume (K Tons), by Country 2024 & 2032
- Figure 13: Asia Pacific Formulation Additive Market Revenue Share (%), by Country 2024 & 2032
- Figure 14: Asia Pacific Formulation Additive Market Volume Share (%), by Country 2024 & 2032
- Figure 15: South America Formulation Additive Market Revenue (Million), by Country 2024 & 2032
- Figure 16: South America Formulation Additive Market Volume (K Tons), by Country 2024 & 2032
- Figure 17: South America Formulation Additive Market Revenue Share (%), by Country 2024 & 2032
- Figure 18: South America Formulation Additive Market Volume Share (%), by Country 2024 & 2032
- Figure 19: MEA Formulation Additive Market Revenue (Million), by Country 2024 & 2032
- Figure 20: MEA Formulation Additive Market Volume (K Tons), by Country 2024 & 2032
- Figure 21: MEA Formulation Additive Market Revenue Share (%), by Country 2024 & 2032
- Figure 22: MEA Formulation Additive Market Volume Share (%), by Country 2024 & 2032
- Figure 23: Asia Pacific Formulation Additive Market Revenue (Million), by Type 2024 & 2032
- Figure 24: Asia Pacific Formulation Additive Market Volume (K Tons), by Type 2024 & 2032
- Figure 25: Asia Pacific Formulation Additive Market Revenue Share (%), by Type 2024 & 2032
- Figure 26: Asia Pacific Formulation Additive Market Volume Share (%), by Type 2024 & 2032
- Figure 27: Asia Pacific Formulation Additive Market Revenue (Million), by End-user Industry 2024 & 2032
- Figure 28: Asia Pacific Formulation Additive Market Volume (K Tons), by End-user Industry 2024 & 2032
- Figure 29: Asia Pacific Formulation Additive Market Revenue Share (%), by End-user Industry 2024 & 2032
- Figure 30: Asia Pacific Formulation Additive Market Volume Share (%), by End-user Industry 2024 & 2032
- Figure 31: Asia Pacific Formulation Additive Market Revenue (Million), by Country 2024 & 2032
- Figure 32: Asia Pacific Formulation Additive Market Volume (K Tons), by Country 2024 & 2032
- Figure 33: Asia Pacific Formulation Additive Market Revenue Share (%), by Country 2024 & 2032
- Figure 34: Asia Pacific Formulation Additive Market Volume Share (%), by Country 2024 & 2032
- Figure 35: North America Formulation Additive Market Revenue (Million), by Type 2024 & 2032
- Figure 36: North America Formulation Additive Market Volume (K Tons), by Type 2024 & 2032
- Figure 37: North America Formulation Additive Market Revenue Share (%), by Type 2024 & 2032
- Figure 38: North America Formulation Additive Market Volume Share (%), by Type 2024 & 2032
- Figure 39: North America Formulation Additive Market Revenue (Million), by End-user Industry 2024 & 2032
- Figure 40: North America Formulation Additive Market Volume (K Tons), by End-user Industry 2024 & 2032
- Figure 41: North America Formulation Additive Market Revenue Share (%), by End-user Industry 2024 & 2032
- Figure 42: North America Formulation Additive Market Volume Share (%), by End-user Industry 2024 & 2032
- Figure 43: North America Formulation Additive Market Revenue (Million), by Country 2024 & 2032
- Figure 44: North America Formulation Additive Market Volume (K Tons), by Country 2024 & 2032
- Figure 45: North America Formulation Additive Market Revenue Share (%), by Country 2024 & 2032
- Figure 46: North America Formulation Additive Market Volume Share (%), by Country 2024 & 2032
- Figure 47: Europe Formulation Additive Market Revenue (Million), by Type 2024 & 2032
- Figure 48: Europe Formulation Additive Market Volume (K Tons), by Type 2024 & 2032
- Figure 49: Europe Formulation Additive Market Revenue Share (%), by Type 2024 & 2032
- Figure 50: Europe Formulation Additive Market Volume Share (%), by Type 2024 & 2032
- Figure 51: Europe Formulation Additive Market Revenue (Million), by End-user Industry 2024 & 2032
- Figure 52: Europe Formulation Additive Market Volume (K Tons), by End-user Industry 2024 & 2032
- Figure 53: Europe Formulation Additive Market Revenue Share (%), by End-user Industry 2024 & 2032
- Figure 54: Europe Formulation Additive Market Volume Share (%), by End-user Industry 2024 & 2032
- Figure 55: Europe Formulation Additive Market Revenue (Million), by Country 2024 & 2032
- Figure 56: Europe Formulation Additive Market Volume (K Tons), by Country 2024 & 2032
- Figure 57: Europe Formulation Additive Market Revenue Share (%), by Country 2024 & 2032
- Figure 58: Europe Formulation Additive Market Volume Share (%), by Country 2024 & 2032
- Figure 59: South America Formulation Additive Market Revenue (Million), by Type 2024 & 2032
- Figure 60: South America Formulation Additive Market Volume (K Tons), by Type 2024 & 2032
- Figure 61: South America Formulation Additive Market Revenue Share (%), by Type 2024 & 2032
- Figure 62: South America Formulation Additive Market Volume Share (%), by Type 2024 & 2032
- Figure 63: South America Formulation Additive Market Revenue (Million), by End-user Industry 2024 & 2032
- Figure 64: South America Formulation Additive Market Volume (K Tons), by End-user Industry 2024 & 2032
- Figure 65: South America Formulation Additive Market Revenue Share (%), by End-user Industry 2024 & 2032
- Figure 66: South America Formulation Additive Market Volume Share (%), by End-user Industry 2024 & 2032
- Figure 67: South America Formulation Additive Market Revenue (Million), by Country 2024 & 2032
- Figure 68: South America Formulation Additive Market Volume (K Tons), by Country 2024 & 2032
- Figure 69: South America Formulation Additive Market Revenue Share (%), by Country 2024 & 2032
- Figure 70: South America Formulation Additive Market Volume Share (%), by Country 2024 & 2032
- Figure 71: Middle East and Africa Formulation Additive Market Revenue (Million), by Type 2024 & 2032
- Figure 72: Middle East and Africa Formulation Additive Market Volume (K Tons), by Type 2024 & 2032
- Figure 73: Middle East and Africa Formulation Additive Market Revenue Share (%), by Type 2024 & 2032
- Figure 74: Middle East and Africa Formulation Additive Market Volume Share (%), by Type 2024 & 2032
- Figure 75: Middle East and Africa Formulation Additive Market Revenue (Million), by End-user Industry 2024 & 2032
- Figure 76: Middle East and Africa Formulation Additive Market Volume (K Tons), by End-user Industry 2024 & 2032
- Figure 77: Middle East and Africa Formulation Additive Market Revenue Share (%), by End-user Industry 2024 & 2032
- Figure 78: Middle East and Africa Formulation Additive Market Volume Share (%), by End-user Industry 2024 & 2032
- Figure 79: Middle East and Africa Formulation Additive Market Revenue (Million), by Country 2024 & 2032
- Figure 80: Middle East and Africa Formulation Additive Market Volume (K Tons), by Country 2024 & 2032
- Figure 81: Middle East and Africa Formulation Additive Market Revenue Share (%), by Country 2024 & 2032
- Figure 82: Middle East and Africa Formulation Additive Market Volume Share (%), by Country 2024 & 2032
List of Tables
- Table 1: Global Formulation Additive Market Revenue Million Forecast, by Region 2019 & 2032
- Table 2: Global Formulation Additive Market Volume K Tons Forecast, by Region 2019 & 2032
- Table 3: Global Formulation Additive Market Revenue Million Forecast, by Type 2019 & 2032
- Table 4: Global Formulation Additive Market Volume K Tons Forecast, by Type 2019 & 2032
- Table 5: Global Formulation Additive Market Revenue Million Forecast, by End-user Industry 2019 & 2032
- Table 6: Global Formulation Additive Market Volume K Tons Forecast, by End-user Industry 2019 & 2032
- Table 7: Global Formulation Additive Market Revenue Million Forecast, by Region 2019 & 2032
- Table 8: Global Formulation Additive Market Volume K Tons Forecast, by Region 2019 & 2032
- Table 9: Global Formulation Additive Market Revenue Million Forecast, by Country 2019 & 2032
- Table 10: Global Formulation Additive Market Volume K Tons Forecast, by Country 2019 & 2032
- Table 11: United States Formulation Additive Market Revenue (Million) Forecast, by Application 2019 & 2032
- Table 12: United States Formulation Additive Market Volume (K Tons) Forecast, by Application 2019 & 2032
- Table 13: Canada Formulation Additive Market Revenue (Million) Forecast, by Application 2019 & 2032
- Table 14: Canada Formulation Additive Market Volume (K Tons) Forecast, by Application 2019 & 2032
- Table 15: Mexico Formulation Additive Market Revenue (Million) Forecast, by Application 2019 & 2032
- Table 16: Mexico Formulation Additive Market Volume (K Tons) Forecast, by Application 2019 & 2032
- Table 17: Global Formulation Additive Market Revenue Million Forecast, by Country 2019 & 2032
- Table 18: Global Formulation Additive Market Volume K Tons Forecast, by Country 2019 & 2032
- Table 19: Germany Formulation Additive Market Revenue (Million) Forecast, by Application 2019 & 2032
- Table 20: Germany Formulation Additive Market Volume (K Tons) Forecast, by Application 2019 & 2032
- Table 21: France Formulation Additive Market Revenue (Million) Forecast, by Application 2019 & 2032
- Table 22: France Formulation Additive Market Volume (K Tons) Forecast, by Application 2019 & 2032
- Table 23: Italy Formulation Additive Market Revenue (Million) Forecast, by Application 2019 & 2032
- Table 24: Italy Formulation Additive Market Volume (K Tons) Forecast, by Application 2019 & 2032
- Table 25: United Kingdom Formulation Additive Market Revenue (Million) Forecast, by Application 2019 & 2032
- Table 26: United Kingdom Formulation Additive Market Volume (K Tons) Forecast, by Application 2019 & 2032
- Table 27: Netherlands Formulation Additive Market Revenue (Million) Forecast, by Application 2019 & 2032
- Table 28: Netherlands Formulation Additive Market Volume (K Tons) Forecast, by Application 2019 & 2032
- Table 29: Rest of Europe Formulation Additive Market Revenue (Million) Forecast, by Application 2019 & 2032
- Table 30: Rest of Europe Formulation Additive Market Volume (K Tons) Forecast, by Application 2019 & 2032
- Table 31: Global Formulation Additive Market Revenue Million Forecast, by Country 2019 & 2032
- Table 32: Global Formulation Additive Market Volume K Tons Forecast, by Country 2019 & 2032
- Table 33: China Formulation Additive Market Revenue (Million) Forecast, by Application 2019 & 2032
- Table 34: China Formulation Additive Market Volume (K Tons) Forecast, by Application 2019 & 2032
- Table 35: Japan Formulation Additive Market Revenue (Million) Forecast, by Application 2019 & 2032
- Table 36: Japan Formulation Additive Market Volume (K Tons) Forecast, by Application 2019 & 2032
- Table 37: India Formulation Additive Market Revenue (Million) Forecast, by Application 2019 & 2032
- Table 38: India Formulation Additive Market Volume (K Tons) Forecast, by Application 2019 & 2032
- Table 39: South Korea Formulation Additive Market Revenue (Million) Forecast, by Application 2019 & 2032
- Table 40: South Korea Formulation Additive Market Volume (K Tons) Forecast, by Application 2019 & 2032
- Table 41: Taiwan Formulation Additive Market Revenue (Million) Forecast, by Application 2019 & 2032
- Table 42: Taiwan Formulation Additive Market Volume (K Tons) Forecast, by Application 2019 & 2032
- Table 43: Australia Formulation Additive Market Revenue (Million) Forecast, by Application 2019 & 2032
- Table 44: Australia Formulation Additive Market Volume (K Tons) Forecast, by Application 2019 & 2032
- Table 45: Rest of Asia-Pacific Formulation Additive Market Revenue (Million) Forecast, by Application 2019 & 2032
- Table 46: Rest of Asia-Pacific Formulation Additive Market Volume (K Tons) Forecast, by Application 2019 & 2032
- Table 47: Global Formulation Additive Market Revenue Million Forecast, by Country 2019 & 2032
- Table 48: Global Formulation Additive Market Volume K Tons Forecast, by Country 2019 & 2032
- Table 49: Brazil Formulation Additive Market Revenue (Million) Forecast, by Application 2019 & 2032
- Table 50: Brazil Formulation Additive Market Volume (K Tons) Forecast, by Application 2019 & 2032
- Table 51: Argentina Formulation Additive Market Revenue (Million) Forecast, by Application 2019 & 2032
- Table 52: Argentina Formulation Additive Market Volume (K Tons) Forecast, by Application 2019 & 2032
- Table 53: Rest of South America Formulation Additive Market Revenue (Million) Forecast, by Application 2019 & 2032
- Table 54: Rest of South America Formulation Additive Market Volume (K Tons) Forecast, by Application 2019 & 2032
- Table 55: Global Formulation Additive Market Revenue Million Forecast, by Country 2019 & 2032
- Table 56: Global Formulation Additive Market Volume K Tons Forecast, by Country 2019 & 2032
- Table 57: Middle East Formulation Additive Market Revenue (Million) Forecast, by Application 2019 & 2032
- Table 58: Middle East Formulation Additive Market Volume (K Tons) Forecast, by Application 2019 & 2032
- Table 59: Africa Formulation Additive Market Revenue (Million) Forecast, by Application 2019 & 2032
- Table 60: Africa Formulation Additive Market Volume (K Tons) Forecast, by Application 2019 & 2032
- Table 61: Global Formulation Additive Market Revenue Million Forecast, by Type 2019 & 2032
- Table 62: Global Formulation Additive Market Volume K Tons Forecast, by Type 2019 & 2032
- Table 63: Global Formulation Additive Market Revenue Million Forecast, by End-user Industry 2019 & 2032
- Table 64: Global Formulation Additive Market Volume K Tons Forecast, by End-user Industry 2019 & 2032
- Table 65: Global Formulation Additive Market Revenue Million Forecast, by Country 2019 & 2032
- Table 66: Global Formulation Additive Market Volume K Tons Forecast, by Country 2019 & 2032
- Table 67: China Formulation Additive Market Revenue (Million) Forecast, by Application 2019 & 2032
- Table 68: China Formulation Additive Market Volume (K Tons) Forecast, by Application 2019 & 2032
- Table 69: India Formulation Additive Market Revenue (Million) Forecast, by Application 2019 & 2032
- Table 70: India Formulation Additive Market Volume (K Tons) Forecast, by Application 2019 & 2032
- Table 71: Japan Formulation Additive Market Revenue (Million) Forecast, by Application 2019 & 2032
- Table 72: Japan Formulation Additive Market Volume (K Tons) Forecast, by Application 2019 & 2032
- Table 73: South Korea Formulation Additive Market Revenue (Million) Forecast, by Application 2019 & 2032
- Table 74: South Korea Formulation Additive Market Volume (K Tons) Forecast, by Application 2019 & 2032
- Table 75: Rest of Asia Pacific Formulation Additive Market Revenue (Million) Forecast, by Application 2019 & 2032
- Table 76: Rest of Asia Pacific Formulation Additive Market Volume (K Tons) Forecast, by Application 2019 & 2032
- Table 77: Global Formulation Additive Market Revenue Million Forecast, by Type 2019 & 2032
- Table 78: Global Formulation Additive Market Volume K Tons Forecast, by Type 2019 & 2032
- Table 79: Global Formulation Additive Market Revenue Million Forecast, by End-user Industry 2019 & 2032
- Table 80: Global Formulation Additive Market Volume K Tons Forecast, by End-user Industry 2019 & 2032
- Table 81: Global Formulation Additive Market Revenue Million Forecast, by Country 2019 & 2032
- Table 82: Global Formulation Additive Market Volume K Tons Forecast, by Country 2019 & 2032
- Table 83: United States Formulation Additive Market Revenue (Million) Forecast, by Application 2019 & 2032
- Table 84: United States Formulation Additive Market Volume (K Tons) Forecast, by Application 2019 & 2032
- Table 85: Canada Formulation Additive Market Revenue (Million) Forecast, by Application 2019 & 2032
- Table 86: Canada Formulation Additive Market Volume (K Tons) Forecast, by Application 2019 & 2032
- Table 87: Mexico Formulation Additive Market Revenue (Million) Forecast, by Application 2019 & 2032
- Table 88: Mexico Formulation Additive Market Volume (K Tons) Forecast, by Application 2019 & 2032
- Table 89: Global Formulation Additive Market Revenue Million Forecast, by Type 2019 & 2032
- Table 90: Global Formulation Additive Market Volume K Tons Forecast, by Type 2019 & 2032
- Table 91: Global Formulation Additive Market Revenue Million Forecast, by End-user Industry 2019 & 2032
- Table 92: Global Formulation Additive Market Volume K Tons Forecast, by End-user Industry 2019 & 2032
- Table 93: Global Formulation Additive Market Revenue Million Forecast, by Country 2019 & 2032
- Table 94: Global Formulation Additive Market Volume K Tons Forecast, by Country 2019 & 2032
- Table 95: Germany Formulation Additive Market Revenue (Million) Forecast, by Application 2019 & 2032
- Table 96: Germany Formulation Additive Market Volume (K Tons) Forecast, by Application 2019 & 2032
- Table 97: United Kingdom Formulation Additive Market Revenue (Million) Forecast, by Application 2019 & 2032
- Table 98: United Kingdom Formulation Additive Market Volume (K Tons) Forecast, by Application 2019 & 2032
- Table 99: France Formulation Additive Market Revenue (Million) Forecast, by Application 2019 & 2032
- Table 100: France Formulation Additive Market Volume (K Tons) Forecast, by Application 2019 & 2032
- Table 101: Italy Formulation Additive Market Revenue (Million) Forecast, by Application 2019 & 2032
- Table 102: Italy Formulation Additive Market Volume (K Tons) Forecast, by Application 2019 & 2032
- Table 103: Rest of Europe Formulation Additive Market Revenue (Million) Forecast, by Application 2019 & 2032
- Table 104: Rest of Europe Formulation Additive Market Volume (K Tons) Forecast, by Application 2019 & 2032
- Table 105: Global Formulation Additive Market Revenue Million Forecast, by Type 2019 & 2032
- Table 106: Global Formulation Additive Market Volume K Tons Forecast, by Type 2019 & 2032
- Table 107: Global Formulation Additive Market Revenue Million Forecast, by End-user Industry 2019 & 2032
- Table 108: Global Formulation Additive Market Volume K Tons Forecast, by End-user Industry 2019 & 2032
- Table 109: Global Formulation Additive Market Revenue Million Forecast, by Country 2019 & 2032
- Table 110: Global Formulation Additive Market Volume K Tons Forecast, by Country 2019 & 2032
- Table 111: Brazil Formulation Additive Market Revenue (Million) Forecast, by Application 2019 & 2032
- Table 112: Brazil Formulation Additive Market Volume (K Tons) Forecast, by Application 2019 & 2032
- Table 113: Argentina Formulation Additive Market Revenue (Million) Forecast, by Application 2019 & 2032
- Table 114: Argentina Formulation Additive Market Volume (K Tons) Forecast, by Application 2019 & 2032
- Table 115: Rest of South America Formulation Additive Market Revenue (Million) Forecast, by Application 2019 & 2032
- Table 116: Rest of South America Formulation Additive Market Volume (K Tons) Forecast, by Application 2019 & 2032
- Table 117: Global Formulation Additive Market Revenue Million Forecast, by Type 2019 & 2032
- Table 118: Global Formulation Additive Market Volume K Tons Forecast, by Type 2019 & 2032
- Table 119: Global Formulation Additive Market Revenue Million Forecast, by End-user Industry 2019 & 2032
- Table 120: Global Formulation Additive Market Volume K Tons Forecast, by End-user Industry 2019 & 2032
- Table 121: Global Formulation Additive Market Revenue Million Forecast, by Country 2019 & 2032
- Table 122: Global Formulation Additive Market Volume K Tons Forecast, by Country 2019 & 2032
- Table 123: Saudi Arabia Formulation Additive Market Revenue (Million) Forecast, by Application 2019 & 2032
- Table 124: Saudi Arabia Formulation Additive Market Volume (K Tons) Forecast, by Application 2019 & 2032
- Table 125: South Africa Formulation Additive Market Revenue (Million) Forecast, by Application 2019 & 2032
- Table 126: South Africa Formulation Additive Market Volume (K Tons) Forecast, by Application 2019 & 2032
- Table 127: Rest of Middle East and Africa Formulation Additive Market Revenue (Million) Forecast, by Application 2019 & 2032
- Table 128: Rest of Middle East and Africa Formulation Additive Market Volume (K Tons) Forecast, by Application 2019 & 2032
Frequently Asked Questions
1. What is the projected Compound Annual Growth Rate (CAGR) of the Formulation Additive Market?
The projected CAGR is approximately > 4.00%.
2. Which companies are prominent players in the Formulation Additive Market?
Key companies in the market include Honeywell International Inc, Arkema, BYK (A member of ALTANA), Evonik Industries AG, Cabot Corporation, LANXESS, Momentive, BASF SE, Huntsman International LLC, Dow, Eastman Chemical Company, MÜNZING Corporation.
3. What are the main segments of the Formulation Additive Market?
The market segments include Type, End-user Industry.
4. Can you provide details about the market size?
The market size is estimated to be USD XX Million as of 2022.
5. What are some drivers contributing to market growth?
; Increase Demand from Construction and Transportation Industries; Other Drivers.
6. What are the notable trends driving market growth?
Construction Sector to Dominate the Market.
7. Are there any restraints impacting market growth?
; Fluctuating Raw Material Prices; Unfavorable Conditions Arising Due to COVID-19.
8. Can you provide examples of recent developments in the market?
N/A
9. What pricing options are available for accessing the report?
Pricing options include single-user, multi-user, and enterprise licenses priced at USD 4750, USD 5250, and USD 8750 respectively.
10. Is the market size provided in terms of value or volume?
The market size is provided in terms of value, measured in Million and volume, measured in K Tons.
11. Are there any specific market keywords associated with the report?
Yes, the market keyword associated with the report is "Formulation Additive Market," which aids in identifying and referencing the specific market segment covered.
12. How do I determine which pricing option suits my needs best?
The pricing options vary based on user requirements and access needs. Individual users may opt for single-user licenses, while businesses requiring broader access may choose multi-user or enterprise licenses for cost-effective access to the report.
13. Are there any additional resources or data provided in the Formulation Additive Market report?
While the report offers comprehensive insights, it's advisable to review the specific contents or supplementary materials provided to ascertain if additional resources or data are available.
14. How can I stay updated on further developments or reports in the Formulation Additive Market?
To stay informed about further developments, trends, and reports in the Formulation Additive Market, consider subscribing to industry newsletters, following relevant companies and organizations, or regularly checking reputable industry news sources and publications.
Methodology
Step 1 - Identification of Relevant Samples Size from Population Database


Step 2 - Approaches for Defining Global Market Size (Value, Volume* & Price*)

Note*: In applicable scenarios
Step 3 - Data Sources
Primary Research
- Web Analytics
- Survey Reports
- Research Institute
- Latest Research Reports
- Opinion Leaders
Secondary Research
- Annual Reports
- White Paper
- Latest Press Release
- Industry Association
- Paid Database
- Investor Presentations

Step 4 - Data Triangulation
Involves using different sources of information in order to increase the validity of a study
These sources are likely to be stakeholders in a program - participants, other researchers, program staff, other community members, and so on.
Then we put all data in single framework & apply various statistical tools to find out the dynamic on the market.
During the analysis stage, feedback from the stakeholder groups would be compared to determine areas of agreement as well as areas of divergence
