

Key Insights
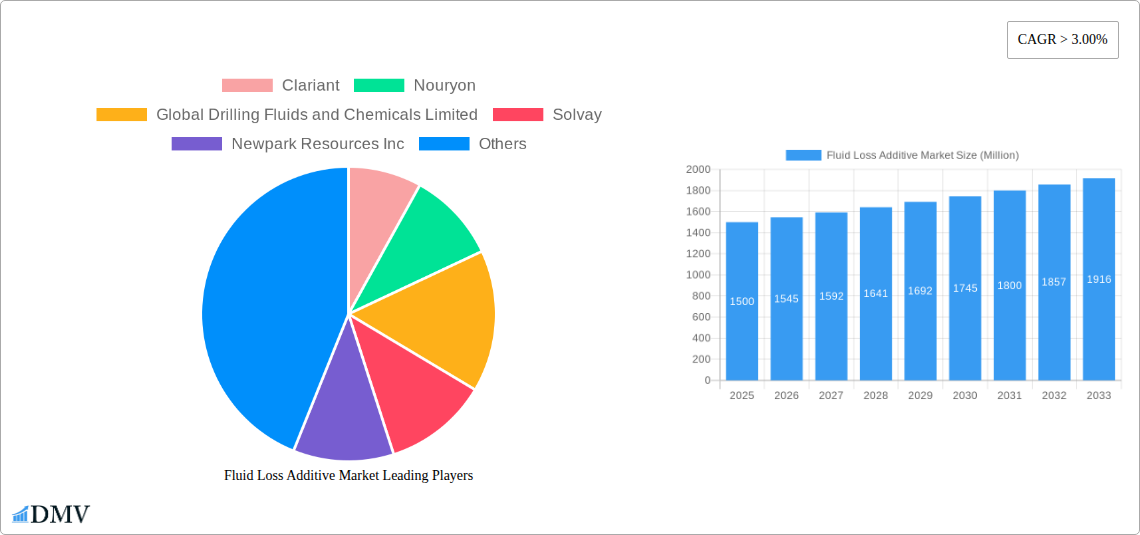
The global Fluid Loss Additive market is experiencing robust growth, projected to maintain a CAGR exceeding 3.00% from 2025 to 2033. This expansion is driven by the increasing demand for enhanced drilling efficiency in the oil and gas industry, coupled with the growing adoption of advanced drilling techniques across various regions. The synthetic additive segment currently dominates the market due to its superior performance characteristics, including better temperature and pressure resistance compared to natural alternatives. However, the synthetically modified natural segment is witnessing significant growth, fueled by the rising focus on environmentally friendly solutions and the increasing awareness of the environmental impact of synthetic additives. Key applications include drilling fluids and cement slurries, both vital components in well construction and completion. The Asia-Pacific region, particularly China and India, are expected to be major contributors to market growth due to their extensive oil and gas exploration activities. North America and Europe also represent significant markets, driven by ongoing exploration and production operations. Leading players like Clariant, Nouryon, and Halliburton are strategically investing in research and development to improve additive performance and expand their market share. Competition is intense, with companies focusing on innovation, cost-effectiveness, and the provision of tailored solutions to meet the specific needs of their clients.
The market's growth trajectory is projected to be influenced by several factors. Stricter environmental regulations are driving the development and adoption of eco-friendly additives. Furthermore, technological advancements, such as the development of nanotechnology-based additives, are enhancing the performance and efficiency of existing solutions. However, fluctuations in crude oil prices and economic downturns can negatively impact market growth. The market's segmentation by additive type and application allows for focused analysis, offering valuable insights into specific market niches and potential investment opportunities. Future growth will depend on sustained investment in exploration and production activities, the successful implementation of environmentally sustainable practices, and the continuous innovation in additive technology.
Fluid Loss Additive Market: A Comprehensive Report (2019-2033)
This insightful report provides a detailed analysis of the global Fluid Loss Additive market, offering a comprehensive overview of its current state, future trajectory, and key players. Covering the period from 2019 to 2033, with 2025 as the base year, this report is an indispensable resource for stakeholders seeking to understand and capitalize on opportunities within this dynamic market. The market is projected to reach xx Million by 2033.
Fluid Loss Additive Market Market Composition & Trends
This section delves into the intricate composition of the Fluid Loss Additive market, examining its concentration, innovation drivers, regulatory landscape, substitute products, end-user profiles, and mergers & acquisitions (M&A) activities. The market exhibits a moderately concentrated structure, with key players like Clariant, Nouryon, and Halliburton holding significant market share. However, the presence of several smaller, specialized companies fosters competition and innovation.
- Market Share Distribution (2024): Clariant (15%), Nouryon (12%), Halliburton (10%), Others (63%). (Note: These figures are estimated)
- Innovation Catalysts: Stringent environmental regulations are driving the development of eco-friendly additives, while the demand for enhanced performance in extreme drilling conditions fuels innovation in material science.
- Regulatory Landscape: Varying regulations across different regions influence product formulation and market access. Compliance with environmental and safety standards is paramount.
- Substitute Products: While limited, certain polymers and modified clays offer partial substitution, but they often compromise performance.
- End-User Profiles: The primary end-users are oil & gas exploration and production companies, construction firms (cement applications), and water management industries.
- M&A Activities (2019-2024): A total estimated value of xx Million in M&A deals, largely driven by consolidation among smaller players and expansion into new geographical markets.
Fluid Loss Additive Market Industry Evolution
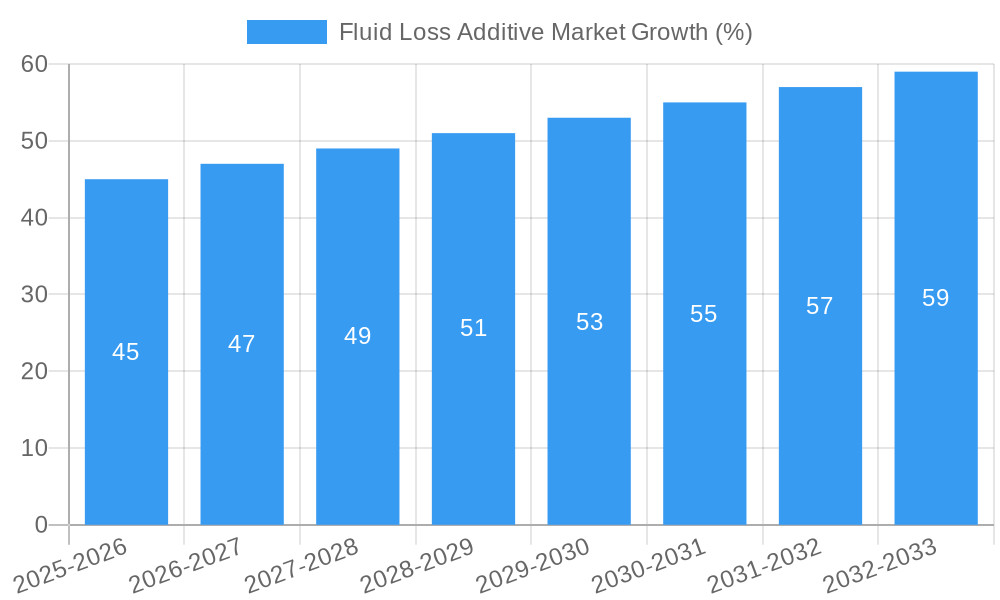
This section analyzes the historical and projected growth trajectories of the Fluid Loss Additive market, factoring in technological advancements and evolving consumer demands. The market witnessed significant growth during the historical period (2019-2024), driven primarily by increased oil & gas exploration activities and infrastructure development. Technological advancements, such as the development of high-performance synthetic polymers and nanomaterials, have enhanced additive performance, leading to improved drilling efficiency and reduced environmental impact. The forecast period (2025-2033) anticipates continued growth, albeit at a potentially moderated pace due to fluctuating oil prices and increasing scrutiny of environmental impact. The Compound Annual Growth Rate (CAGR) for the forecast period is estimated to be xx%. Demand for sustainable solutions will shape future market dynamics, emphasizing the need for biodegradable and environmentally benign additives.
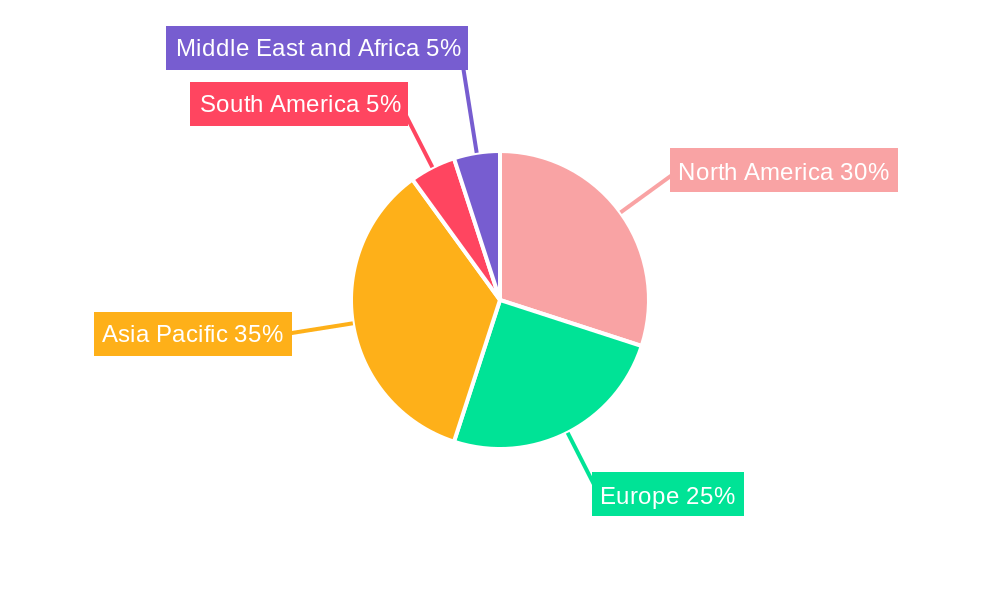
Leading Regions, Countries, or Segments in Fluid Loss Additive Market
This section identifies the dominant regions, countries, and segments within the Fluid Loss Additive market.
Dominant Region: North America currently holds the largest market share, driven by extensive oil and gas activities and robust infrastructure development.
Dominant Segments:
- Additive Type: Synthetic additives dominate due to their superior performance characteristics, although demand for environmentally friendly natural and synthetically modified natural additives is rising.
- Application: Drilling fluids constitute the largest application segment, owing to the substantial requirements of the oil and gas industry.
Key Drivers:
- North America: High oil & gas production, strong regulatory support for technological advancements, and substantial investments in infrastructure projects.
- Synthetic Additives: Superior performance, including enhanced viscosity control and reduced fluid loss, leading to improved drilling efficiency and cost savings.
- Drilling Fluid Applications: The substantial demand from oil and gas exploration and production activities.
Fluid Loss Additive Market Product Innovations
Recent innovations include the development of environmentally friendly, biodegradable polymers that meet stringent environmental regulations while maintaining excellent performance characteristics. These advancements are driving increased adoption in environmentally sensitive regions and projects. Further improvements focus on optimizing rheological properties for improved drilling efficiency, and developing additives tailored for specific geological conditions. Unique selling propositions include superior performance at high temperatures and pressures, enhanced compatibility with various drilling fluids, and reduced environmental impact.
Propelling Factors for Fluid Loss Additive Market Growth
Several factors propel Fluid Loss Additive market growth. Firstly, the continuous rise in global energy demand fuels increased oil and gas exploration activities, driving the need for efficient drilling fluids. Secondly, technological advancements resulting in enhanced performance additives contribute to improved drilling efficiency and cost reduction. Thirdly, stringent environmental regulations necessitate the development of sustainable and environmentally friendly additives, which in turn creates market opportunities.
Obstacles in the Fluid Loss Additive Market Market
The Fluid Loss Additive market faces challenges such as fluctuating oil prices, which impact exploration and production budgets. Supply chain disruptions can affect the availability of raw materials, hindering production and potentially increasing costs. Furthermore, intense competition among established players and the entry of new entrants exert pressure on pricing and profitability. Regulatory changes and evolving environmental standards can necessitate significant investments in product reformulation and compliance.
Future Opportunities in Fluid Loss Additive Market
Future opportunities exist in the development of advanced materials, such as nanomaterials, to enhance additive performance and efficiency. Expanding into emerging markets in Asia and Africa presents significant growth potential, driven by increasing infrastructure development and energy demand. Furthermore, the focus on sustainable solutions, including biodegradable and environmentally friendly additives, will continue to drive innovation and market expansion.
Major Players in the Fluid Loss Additive Market Ecosystem
- Clariant
- Nouryon
- Global Drilling Fluids and Chemicals Limited
- Solvay
- Newpark Resources Inc
- Kemira OYJ
- BASF SE
- Tytan Organics Pvt Ltd
- Halliburton
- Schlumberger Limited
Key Developments in Fluid Loss Additive Market Industry
- January 2023: Clariant launches a new line of environmentally friendly fluid loss additives.
- June 2022: Halliburton acquires a smaller competitor, expanding its market share. (Note: Specific details on acquisition values are not available and require further research).
- October 2021: Nouryon announces a significant investment in research and development for sustainable fluid loss additives. (Note: Specific investment amount unavailable)
Strategic Fluid Loss Additive Market Market Forecast
The Fluid Loss Additive market is poised for continued growth, driven by increasing demand from the oil and gas industry and the construction sector. Technological advancements focused on sustainability and enhanced performance will shape future market dynamics. The development of innovative, eco-friendly additives and expansion into new geographical markets present significant opportunities for growth and market share expansion. The market is expected to remain moderately concentrated, with larger players benefiting from economies of scale and technological advancements.
Fluid Loss Additive Market Segmentation
-
1. Additive Type
- 1.1. Synthetic
- 1.2. Natural
- 1.3. Synthetically Modified Natural
-
2. Application
- 2.1. Drilling Fluid
- 2.2. Cement Slurry
Fluid Loss Additive Market Segmentation By Geography
-
1. Asia Pacific
- 1.1. China
- 1.2. India
- 1.3. Japan
- 1.4. South Korea
- 1.5. Rest of Asia Pacific
-
2. North America
- 2.1. United States
- 2.2. Canada
- 2.3. Mexico
-
3. Europe
- 3.1. Germany
- 3.2. United Kingdom
- 3.3. France
- 3.4. Italy
- 3.5. Rest of Europe
-
4. South America
- 4.1. Brazil
- 4.2. Argentina
- 4.3. Rest of South America
-
5. Middle East and Africa
- 5.1. Saudi Arabia
- 5.2. South Africa
- 5.3. Rest of Middle East and Africa
Fluid Loss Additive Market REPORT HIGHLIGHTS
| Aspects | Details |
|---|---|
| Study Period | 2019-2033 |
| Base Year | 2024 |
| Estimated Year | 2025 |
| Forecast Period | 2025-2033 |
| Historical Period | 2019-2024 |
| Growth Rate | CAGR of > 3.00% from 2019-2033 |
| Segmentation |
|
Table of Contents
- 1. Introduction
- 1.1. Research Scope
- 1.2. Market Segmentation
- 1.3. Research Methodology
- 1.4. Definitions and Assumptions
- 2. Executive Summary
- 2.1. Introduction
- 3. Market Dynamics
- 3.1. Introduction
- 3.2. Market Drivers
- 3.2.1. ; Increase in Shale Gas Exploration; Increasing Investments in the Latest and Unconventional Drilling Technologies
- 3.3. Market Restrains
- 3.3.1. ; Growing Demand for Electric Vehicles; Harmful Impact on Environment
- 3.4. Market Trends
- 3.4.1. Drilling Fluid Application to Dominate the Market
- 4. Market Factor Analysis
- 4.1. Porters Five Forces
- 4.2. Supply/Value Chain
- 4.3. PESTEL analysis
- 4.4. Market Entropy
- 4.5. Patent/Trademark Analysis
- 5. Global Fluid Loss Additive Market Analysis, Insights and Forecast, 2019-2031
- 5.1. Market Analysis, Insights and Forecast - by Additive Type
- 5.1.1. Synthetic
- 5.1.2. Natural
- 5.1.3. Synthetically Modified Natural
- 5.2. Market Analysis, Insights and Forecast - by Application
- 5.2.1. Drilling Fluid
- 5.2.2. Cement Slurry
- 5.3. Market Analysis, Insights and Forecast - by Region
- 5.3.1. Asia Pacific
- 5.3.2. North America
- 5.3.3. Europe
- 5.3.4. South America
- 5.3.5. Middle East and Africa
- 5.1. Market Analysis, Insights and Forecast - by Additive Type
- 6. Asia Pacific Fluid Loss Additive Market Analysis, Insights and Forecast, 2019-2031
- 6.1. Market Analysis, Insights and Forecast - by Additive Type
- 6.1.1. Synthetic
- 6.1.2. Natural
- 6.1.3. Synthetically Modified Natural
- 6.2. Market Analysis, Insights and Forecast - by Application
- 6.2.1. Drilling Fluid
- 6.2.2. Cement Slurry
- 6.1. Market Analysis, Insights and Forecast - by Additive Type
- 7. North America Fluid Loss Additive Market Analysis, Insights and Forecast, 2019-2031
- 7.1. Market Analysis, Insights and Forecast - by Additive Type
- 7.1.1. Synthetic
- 7.1.2. Natural
- 7.1.3. Synthetically Modified Natural
- 7.2. Market Analysis, Insights and Forecast - by Application
- 7.2.1. Drilling Fluid
- 7.2.2. Cement Slurry
- 7.1. Market Analysis, Insights and Forecast - by Additive Type
- 8. Europe Fluid Loss Additive Market Analysis, Insights and Forecast, 2019-2031
- 8.1. Market Analysis, Insights and Forecast - by Additive Type
- 8.1.1. Synthetic
- 8.1.2. Natural
- 8.1.3. Synthetically Modified Natural
- 8.2. Market Analysis, Insights and Forecast - by Application
- 8.2.1. Drilling Fluid
- 8.2.2. Cement Slurry
- 8.1. Market Analysis, Insights and Forecast - by Additive Type
- 9. South America Fluid Loss Additive Market Analysis, Insights and Forecast, 2019-2031
- 9.1. Market Analysis, Insights and Forecast - by Additive Type
- 9.1.1. Synthetic
- 9.1.2. Natural
- 9.1.3. Synthetically Modified Natural
- 9.2. Market Analysis, Insights and Forecast - by Application
- 9.2.1. Drilling Fluid
- 9.2.2. Cement Slurry
- 9.1. Market Analysis, Insights and Forecast - by Additive Type
- 10. Middle East and Africa Fluid Loss Additive Market Analysis, Insights and Forecast, 2019-2031
- 10.1. Market Analysis, Insights and Forecast - by Additive Type
- 10.1.1. Synthetic
- 10.1.2. Natural
- 10.1.3. Synthetically Modified Natural
- 10.2. Market Analysis, Insights and Forecast - by Application
- 10.2.1. Drilling Fluid
- 10.2.2. Cement Slurry
- 10.1. Market Analysis, Insights and Forecast - by Additive Type
- 11. Asia Pacific Fluid Loss Additive Market Analysis, Insights and Forecast, 2019-2031
- 11.1. Market Analysis, Insights and Forecast - By Country/Sub-region
- 11.1.1 China
- 11.1.2 India
- 11.1.3 Japan
- 11.1.4 South Korea
- 11.1.5 Rest of Asia Pacific
- 12. North America Fluid Loss Additive Market Analysis, Insights and Forecast, 2019-2031
- 12.1. Market Analysis, Insights and Forecast - By Country/Sub-region
- 12.1.1 United States
- 12.1.2 Canada
- 12.1.3 Mexico
- 13. Europe Fluid Loss Additive Market Analysis, Insights and Forecast, 2019-2031
- 13.1. Market Analysis, Insights and Forecast - By Country/Sub-region
- 13.1.1 Germany
- 13.1.2 United Kingdom
- 13.1.3 France
- 13.1.4 Italy
- 13.1.5 Rest of Europe
- 14. South America Fluid Loss Additive Market Analysis, Insights and Forecast, 2019-2031
- 14.1. Market Analysis, Insights and Forecast - By Country/Sub-region
- 14.1.1 Brazil
- 14.1.2 Argentina
- 14.1.3 Rest of South America
- 15. Middle East and Africa Fluid Loss Additive Market Analysis, Insights and Forecast, 2019-2031
- 15.1. Market Analysis, Insights and Forecast - By Country/Sub-region
- 15.1.1 Saudi Arabia
- 15.1.2 South Africa
- 15.1.3 Rest of Middle East and Africa
- 16. Competitive Analysis
- 16.1. Global Market Share Analysis 2024
- 16.2. Company Profiles
- 16.2.1 Clariant
- 16.2.1.1. Overview
- 16.2.1.2. Products
- 16.2.1.3. SWOT Analysis
- 16.2.1.4. Recent Developments
- 16.2.1.5. Financials (Based on Availability)
- 16.2.2 Nouryon
- 16.2.2.1. Overview
- 16.2.2.2. Products
- 16.2.2.3. SWOT Analysis
- 16.2.2.4. Recent Developments
- 16.2.2.5. Financials (Based on Availability)
- 16.2.3 Global Drilling Fluids and Chemicals Limited
- 16.2.3.1. Overview
- 16.2.3.2. Products
- 16.2.3.3. SWOT Analysis
- 16.2.3.4. Recent Developments
- 16.2.3.5. Financials (Based on Availability)
- 16.2.4 Solvay
- 16.2.4.1. Overview
- 16.2.4.2. Products
- 16.2.4.3. SWOT Analysis
- 16.2.4.4. Recent Developments
- 16.2.4.5. Financials (Based on Availability)
- 16.2.5 Newpark Resources Inc
- 16.2.5.1. Overview
- 16.2.5.2. Products
- 16.2.5.3. SWOT Analysis
- 16.2.5.4. Recent Developments
- 16.2.5.5. Financials (Based on Availability)
- 16.2.6 Kemira OYJ
- 16.2.6.1. Overview
- 16.2.6.2. Products
- 16.2.6.3. SWOT Analysis
- 16.2.6.4. Recent Developments
- 16.2.6.5. Financials (Based on Availability)
- 16.2.7 BASF SE
- 16.2.7.1. Overview
- 16.2.7.2. Products
- 16.2.7.3. SWOT Analysis
- 16.2.7.4. Recent Developments
- 16.2.7.5. Financials (Based on Availability)
- 16.2.8 Tytan Organics Pvt Ltd
- 16.2.8.1. Overview
- 16.2.8.2. Products
- 16.2.8.3. SWOT Analysis
- 16.2.8.4. Recent Developments
- 16.2.8.5. Financials (Based on Availability)
- 16.2.9 Halliburton
- 16.2.9.1. Overview
- 16.2.9.2. Products
- 16.2.9.3. SWOT Analysis
- 16.2.9.4. Recent Developments
- 16.2.9.5. Financials (Based on Availability)
- 16.2.10 Schlumberger Limited
- 16.2.10.1. Overview
- 16.2.10.2. Products
- 16.2.10.3. SWOT Analysis
- 16.2.10.4. Recent Developments
- 16.2.10.5. Financials (Based on Availability)
- 16.2.1 Clariant
List of Figures
- Figure 1: Global Fluid Loss Additive Market Revenue Breakdown (Million, %) by Region 2024 & 2032
- Figure 2: Global Fluid Loss Additive Market Volume Breakdown (kg/m3, %) by Region 2024 & 2032
- Figure 3: Asia Pacific Fluid Loss Additive Market Revenue (Million), by Country 2024 & 2032
- Figure 4: Asia Pacific Fluid Loss Additive Market Volume (kg/m3), by Country 2024 & 2032
- Figure 5: Asia Pacific Fluid Loss Additive Market Revenue Share (%), by Country 2024 & 2032
- Figure 6: Asia Pacific Fluid Loss Additive Market Volume Share (%), by Country 2024 & 2032
- Figure 7: North America Fluid Loss Additive Market Revenue (Million), by Country 2024 & 2032
- Figure 8: North America Fluid Loss Additive Market Volume (kg/m3), by Country 2024 & 2032
- Figure 9: North America Fluid Loss Additive Market Revenue Share (%), by Country 2024 & 2032
- Figure 10: North America Fluid Loss Additive Market Volume Share (%), by Country 2024 & 2032
- Figure 11: Europe Fluid Loss Additive Market Revenue (Million), by Country 2024 & 2032
- Figure 12: Europe Fluid Loss Additive Market Volume (kg/m3), by Country 2024 & 2032
- Figure 13: Europe Fluid Loss Additive Market Revenue Share (%), by Country 2024 & 2032
- Figure 14: Europe Fluid Loss Additive Market Volume Share (%), by Country 2024 & 2032
- Figure 15: South America Fluid Loss Additive Market Revenue (Million), by Country 2024 & 2032
- Figure 16: South America Fluid Loss Additive Market Volume (kg/m3), by Country 2024 & 2032
- Figure 17: South America Fluid Loss Additive Market Revenue Share (%), by Country 2024 & 2032
- Figure 18: South America Fluid Loss Additive Market Volume Share (%), by Country 2024 & 2032
- Figure 19: Middle East and Africa Fluid Loss Additive Market Revenue (Million), by Country 2024 & 2032
- Figure 20: Middle East and Africa Fluid Loss Additive Market Volume (kg/m3), by Country 2024 & 2032
- Figure 21: Middle East and Africa Fluid Loss Additive Market Revenue Share (%), by Country 2024 & 2032
- Figure 22: Middle East and Africa Fluid Loss Additive Market Volume Share (%), by Country 2024 & 2032
- Figure 23: Asia Pacific Fluid Loss Additive Market Revenue (Million), by Additive Type 2024 & 2032
- Figure 24: Asia Pacific Fluid Loss Additive Market Volume (kg/m3), by Additive Type 2024 & 2032
- Figure 25: Asia Pacific Fluid Loss Additive Market Revenue Share (%), by Additive Type 2024 & 2032
- Figure 26: Asia Pacific Fluid Loss Additive Market Volume Share (%), by Additive Type 2024 & 2032
- Figure 27: Asia Pacific Fluid Loss Additive Market Revenue (Million), by Application 2024 & 2032
- Figure 28: Asia Pacific Fluid Loss Additive Market Volume (kg/m3), by Application 2024 & 2032
- Figure 29: Asia Pacific Fluid Loss Additive Market Revenue Share (%), by Application 2024 & 2032
- Figure 30: Asia Pacific Fluid Loss Additive Market Volume Share (%), by Application 2024 & 2032
- Figure 31: Asia Pacific Fluid Loss Additive Market Revenue (Million), by Country 2024 & 2032
- Figure 32: Asia Pacific Fluid Loss Additive Market Volume (kg/m3), by Country 2024 & 2032
- Figure 33: Asia Pacific Fluid Loss Additive Market Revenue Share (%), by Country 2024 & 2032
- Figure 34: Asia Pacific Fluid Loss Additive Market Volume Share (%), by Country 2024 & 2032
- Figure 35: North America Fluid Loss Additive Market Revenue (Million), by Additive Type 2024 & 2032
- Figure 36: North America Fluid Loss Additive Market Volume (kg/m3), by Additive Type 2024 & 2032
- Figure 37: North America Fluid Loss Additive Market Revenue Share (%), by Additive Type 2024 & 2032
- Figure 38: North America Fluid Loss Additive Market Volume Share (%), by Additive Type 2024 & 2032
- Figure 39: North America Fluid Loss Additive Market Revenue (Million), by Application 2024 & 2032
- Figure 40: North America Fluid Loss Additive Market Volume (kg/m3), by Application 2024 & 2032
- Figure 41: North America Fluid Loss Additive Market Revenue Share (%), by Application 2024 & 2032
- Figure 42: North America Fluid Loss Additive Market Volume Share (%), by Application 2024 & 2032
- Figure 43: North America Fluid Loss Additive Market Revenue (Million), by Country 2024 & 2032
- Figure 44: North America Fluid Loss Additive Market Volume (kg/m3), by Country 2024 & 2032
- Figure 45: North America Fluid Loss Additive Market Revenue Share (%), by Country 2024 & 2032
- Figure 46: North America Fluid Loss Additive Market Volume Share (%), by Country 2024 & 2032
- Figure 47: Europe Fluid Loss Additive Market Revenue (Million), by Additive Type 2024 & 2032
- Figure 48: Europe Fluid Loss Additive Market Volume (kg/m3), by Additive Type 2024 & 2032
- Figure 49: Europe Fluid Loss Additive Market Revenue Share (%), by Additive Type 2024 & 2032
- Figure 50: Europe Fluid Loss Additive Market Volume Share (%), by Additive Type 2024 & 2032
- Figure 51: Europe Fluid Loss Additive Market Revenue (Million), by Application 2024 & 2032
- Figure 52: Europe Fluid Loss Additive Market Volume (kg/m3), by Application 2024 & 2032
- Figure 53: Europe Fluid Loss Additive Market Revenue Share (%), by Application 2024 & 2032
- Figure 54: Europe Fluid Loss Additive Market Volume Share (%), by Application 2024 & 2032
- Figure 55: Europe Fluid Loss Additive Market Revenue (Million), by Country 2024 & 2032
- Figure 56: Europe Fluid Loss Additive Market Volume (kg/m3), by Country 2024 & 2032
- Figure 57: Europe Fluid Loss Additive Market Revenue Share (%), by Country 2024 & 2032
- Figure 58: Europe Fluid Loss Additive Market Volume Share (%), by Country 2024 & 2032
- Figure 59: South America Fluid Loss Additive Market Revenue (Million), by Additive Type 2024 & 2032
- Figure 60: South America Fluid Loss Additive Market Volume (kg/m3), by Additive Type 2024 & 2032
- Figure 61: South America Fluid Loss Additive Market Revenue Share (%), by Additive Type 2024 & 2032
- Figure 62: South America Fluid Loss Additive Market Volume Share (%), by Additive Type 2024 & 2032
- Figure 63: South America Fluid Loss Additive Market Revenue (Million), by Application 2024 & 2032
- Figure 64: South America Fluid Loss Additive Market Volume (kg/m3), by Application 2024 & 2032
- Figure 65: South America Fluid Loss Additive Market Revenue Share (%), by Application 2024 & 2032
- Figure 66: South America Fluid Loss Additive Market Volume Share (%), by Application 2024 & 2032
- Figure 67: South America Fluid Loss Additive Market Revenue (Million), by Country 2024 & 2032
- Figure 68: South America Fluid Loss Additive Market Volume (kg/m3), by Country 2024 & 2032
- Figure 69: South America Fluid Loss Additive Market Revenue Share (%), by Country 2024 & 2032
- Figure 70: South America Fluid Loss Additive Market Volume Share (%), by Country 2024 & 2032
- Figure 71: Middle East and Africa Fluid Loss Additive Market Revenue (Million), by Additive Type 2024 & 2032
- Figure 72: Middle East and Africa Fluid Loss Additive Market Volume (kg/m3), by Additive Type 2024 & 2032
- Figure 73: Middle East and Africa Fluid Loss Additive Market Revenue Share (%), by Additive Type 2024 & 2032
- Figure 74: Middle East and Africa Fluid Loss Additive Market Volume Share (%), by Additive Type 2024 & 2032
- Figure 75: Middle East and Africa Fluid Loss Additive Market Revenue (Million), by Application 2024 & 2032
- Figure 76: Middle East and Africa Fluid Loss Additive Market Volume (kg/m3), by Application 2024 & 2032
- Figure 77: Middle East and Africa Fluid Loss Additive Market Revenue Share (%), by Application 2024 & 2032
- Figure 78: Middle East and Africa Fluid Loss Additive Market Volume Share (%), by Application 2024 & 2032
- Figure 79: Middle East and Africa Fluid Loss Additive Market Revenue (Million), by Country 2024 & 2032
- Figure 80: Middle East and Africa Fluid Loss Additive Market Volume (kg/m3), by Country 2024 & 2032
- Figure 81: Middle East and Africa Fluid Loss Additive Market Revenue Share (%), by Country 2024 & 2032
- Figure 82: Middle East and Africa Fluid Loss Additive Market Volume Share (%), by Country 2024 & 2032
List of Tables
- Table 1: Global Fluid Loss Additive Market Revenue Million Forecast, by Region 2019 & 2032
- Table 2: Global Fluid Loss Additive Market Volume kg/m3 Forecast, by Region 2019 & 2032
- Table 3: Global Fluid Loss Additive Market Revenue Million Forecast, by Additive Type 2019 & 2032
- Table 4: Global Fluid Loss Additive Market Volume kg/m3 Forecast, by Additive Type 2019 & 2032
- Table 5: Global Fluid Loss Additive Market Revenue Million Forecast, by Application 2019 & 2032
- Table 6: Global Fluid Loss Additive Market Volume kg/m3 Forecast, by Application 2019 & 2032
- Table 7: Global Fluid Loss Additive Market Revenue Million Forecast, by Region 2019 & 2032
- Table 8: Global Fluid Loss Additive Market Volume kg/m3 Forecast, by Region 2019 & 2032
- Table 9: Global Fluid Loss Additive Market Revenue Million Forecast, by Country 2019 & 2032
- Table 10: Global Fluid Loss Additive Market Volume kg/m3 Forecast, by Country 2019 & 2032
- Table 11: China Fluid Loss Additive Market Revenue (Million) Forecast, by Application 2019 & 2032
- Table 12: China Fluid Loss Additive Market Volume (kg/m3) Forecast, by Application 2019 & 2032
- Table 13: India Fluid Loss Additive Market Revenue (Million) Forecast, by Application 2019 & 2032
- Table 14: India Fluid Loss Additive Market Volume (kg/m3) Forecast, by Application 2019 & 2032
- Table 15: Japan Fluid Loss Additive Market Revenue (Million) Forecast, by Application 2019 & 2032
- Table 16: Japan Fluid Loss Additive Market Volume (kg/m3) Forecast, by Application 2019 & 2032
- Table 17: South Korea Fluid Loss Additive Market Revenue (Million) Forecast, by Application 2019 & 2032
- Table 18: South Korea Fluid Loss Additive Market Volume (kg/m3) Forecast, by Application 2019 & 2032
- Table 19: Rest of Asia Pacific Fluid Loss Additive Market Revenue (Million) Forecast, by Application 2019 & 2032
- Table 20: Rest of Asia Pacific Fluid Loss Additive Market Volume (kg/m3) Forecast, by Application 2019 & 2032
- Table 21: Global Fluid Loss Additive Market Revenue Million Forecast, by Country 2019 & 2032
- Table 22: Global Fluid Loss Additive Market Volume kg/m3 Forecast, by Country 2019 & 2032
- Table 23: United States Fluid Loss Additive Market Revenue (Million) Forecast, by Application 2019 & 2032
- Table 24: United States Fluid Loss Additive Market Volume (kg/m3) Forecast, by Application 2019 & 2032
- Table 25: Canada Fluid Loss Additive Market Revenue (Million) Forecast, by Application 2019 & 2032
- Table 26: Canada Fluid Loss Additive Market Volume (kg/m3) Forecast, by Application 2019 & 2032
- Table 27: Mexico Fluid Loss Additive Market Revenue (Million) Forecast, by Application 2019 & 2032
- Table 28: Mexico Fluid Loss Additive Market Volume (kg/m3) Forecast, by Application 2019 & 2032
- Table 29: Global Fluid Loss Additive Market Revenue Million Forecast, by Country 2019 & 2032
- Table 30: Global Fluid Loss Additive Market Volume kg/m3 Forecast, by Country 2019 & 2032
- Table 31: Germany Fluid Loss Additive Market Revenue (Million) Forecast, by Application 2019 & 2032
- Table 32: Germany Fluid Loss Additive Market Volume (kg/m3) Forecast, by Application 2019 & 2032
- Table 33: United Kingdom Fluid Loss Additive Market Revenue (Million) Forecast, by Application 2019 & 2032
- Table 34: United Kingdom Fluid Loss Additive Market Volume (kg/m3) Forecast, by Application 2019 & 2032
- Table 35: France Fluid Loss Additive Market Revenue (Million) Forecast, by Application 2019 & 2032
- Table 36: France Fluid Loss Additive Market Volume (kg/m3) Forecast, by Application 2019 & 2032
- Table 37: Italy Fluid Loss Additive Market Revenue (Million) Forecast, by Application 2019 & 2032
- Table 38: Italy Fluid Loss Additive Market Volume (kg/m3) Forecast, by Application 2019 & 2032
- Table 39: Rest of Europe Fluid Loss Additive Market Revenue (Million) Forecast, by Application 2019 & 2032
- Table 40: Rest of Europe Fluid Loss Additive Market Volume (kg/m3) Forecast, by Application 2019 & 2032
- Table 41: Global Fluid Loss Additive Market Revenue Million Forecast, by Country 2019 & 2032
- Table 42: Global Fluid Loss Additive Market Volume kg/m3 Forecast, by Country 2019 & 2032
- Table 43: Brazil Fluid Loss Additive Market Revenue (Million) Forecast, by Application 2019 & 2032
- Table 44: Brazil Fluid Loss Additive Market Volume (kg/m3) Forecast, by Application 2019 & 2032
- Table 45: Argentina Fluid Loss Additive Market Revenue (Million) Forecast, by Application 2019 & 2032
- Table 46: Argentina Fluid Loss Additive Market Volume (kg/m3) Forecast, by Application 2019 & 2032
- Table 47: Rest of South America Fluid Loss Additive Market Revenue (Million) Forecast, by Application 2019 & 2032
- Table 48: Rest of South America Fluid Loss Additive Market Volume (kg/m3) Forecast, by Application 2019 & 2032
- Table 49: Global Fluid Loss Additive Market Revenue Million Forecast, by Country 2019 & 2032
- Table 50: Global Fluid Loss Additive Market Volume kg/m3 Forecast, by Country 2019 & 2032
- Table 51: Saudi Arabia Fluid Loss Additive Market Revenue (Million) Forecast, by Application 2019 & 2032
- Table 52: Saudi Arabia Fluid Loss Additive Market Volume (kg/m3) Forecast, by Application 2019 & 2032
- Table 53: South Africa Fluid Loss Additive Market Revenue (Million) Forecast, by Application 2019 & 2032
- Table 54: South Africa Fluid Loss Additive Market Volume (kg/m3) Forecast, by Application 2019 & 2032
- Table 55: Rest of Middle East and Africa Fluid Loss Additive Market Revenue (Million) Forecast, by Application 2019 & 2032
- Table 56: Rest of Middle East and Africa Fluid Loss Additive Market Volume (kg/m3) Forecast, by Application 2019 & 2032
- Table 57: Global Fluid Loss Additive Market Revenue Million Forecast, by Additive Type 2019 & 2032
- Table 58: Global Fluid Loss Additive Market Volume kg/m3 Forecast, by Additive Type 2019 & 2032
- Table 59: Global Fluid Loss Additive Market Revenue Million Forecast, by Application 2019 & 2032
- Table 60: Global Fluid Loss Additive Market Volume kg/m3 Forecast, by Application 2019 & 2032
- Table 61: Global Fluid Loss Additive Market Revenue Million Forecast, by Country 2019 & 2032
- Table 62: Global Fluid Loss Additive Market Volume kg/m3 Forecast, by Country 2019 & 2032
- Table 63: China Fluid Loss Additive Market Revenue (Million) Forecast, by Application 2019 & 2032
- Table 64: China Fluid Loss Additive Market Volume (kg/m3) Forecast, by Application 2019 & 2032
- Table 65: India Fluid Loss Additive Market Revenue (Million) Forecast, by Application 2019 & 2032
- Table 66: India Fluid Loss Additive Market Volume (kg/m3) Forecast, by Application 2019 & 2032
- Table 67: Japan Fluid Loss Additive Market Revenue (Million) Forecast, by Application 2019 & 2032
- Table 68: Japan Fluid Loss Additive Market Volume (kg/m3) Forecast, by Application 2019 & 2032
- Table 69: South Korea Fluid Loss Additive Market Revenue (Million) Forecast, by Application 2019 & 2032
- Table 70: South Korea Fluid Loss Additive Market Volume (kg/m3) Forecast, by Application 2019 & 2032
- Table 71: Rest of Asia Pacific Fluid Loss Additive Market Revenue (Million) Forecast, by Application 2019 & 2032
- Table 72: Rest of Asia Pacific Fluid Loss Additive Market Volume (kg/m3) Forecast, by Application 2019 & 2032
- Table 73: Global Fluid Loss Additive Market Revenue Million Forecast, by Additive Type 2019 & 2032
- Table 74: Global Fluid Loss Additive Market Volume kg/m3 Forecast, by Additive Type 2019 & 2032
- Table 75: Global Fluid Loss Additive Market Revenue Million Forecast, by Application 2019 & 2032
- Table 76: Global Fluid Loss Additive Market Volume kg/m3 Forecast, by Application 2019 & 2032
- Table 77: Global Fluid Loss Additive Market Revenue Million Forecast, by Country 2019 & 2032
- Table 78: Global Fluid Loss Additive Market Volume kg/m3 Forecast, by Country 2019 & 2032
- Table 79: United States Fluid Loss Additive Market Revenue (Million) Forecast, by Application 2019 & 2032
- Table 80: United States Fluid Loss Additive Market Volume (kg/m3) Forecast, by Application 2019 & 2032
- Table 81: Canada Fluid Loss Additive Market Revenue (Million) Forecast, by Application 2019 & 2032
- Table 82: Canada Fluid Loss Additive Market Volume (kg/m3) Forecast, by Application 2019 & 2032
- Table 83: Mexico Fluid Loss Additive Market Revenue (Million) Forecast, by Application 2019 & 2032
- Table 84: Mexico Fluid Loss Additive Market Volume (kg/m3) Forecast, by Application 2019 & 2032
- Table 85: Global Fluid Loss Additive Market Revenue Million Forecast, by Additive Type 2019 & 2032
- Table 86: Global Fluid Loss Additive Market Volume kg/m3 Forecast, by Additive Type 2019 & 2032
- Table 87: Global Fluid Loss Additive Market Revenue Million Forecast, by Application 2019 & 2032
- Table 88: Global Fluid Loss Additive Market Volume kg/m3 Forecast, by Application 2019 & 2032
- Table 89: Global Fluid Loss Additive Market Revenue Million Forecast, by Country 2019 & 2032
- Table 90: Global Fluid Loss Additive Market Volume kg/m3 Forecast, by Country 2019 & 2032
- Table 91: Germany Fluid Loss Additive Market Revenue (Million) Forecast, by Application 2019 & 2032
- Table 92: Germany Fluid Loss Additive Market Volume (kg/m3) Forecast, by Application 2019 & 2032
- Table 93: United Kingdom Fluid Loss Additive Market Revenue (Million) Forecast, by Application 2019 & 2032
- Table 94: United Kingdom Fluid Loss Additive Market Volume (kg/m3) Forecast, by Application 2019 & 2032
- Table 95: France Fluid Loss Additive Market Revenue (Million) Forecast, by Application 2019 & 2032
- Table 96: France Fluid Loss Additive Market Volume (kg/m3) Forecast, by Application 2019 & 2032
- Table 97: Italy Fluid Loss Additive Market Revenue (Million) Forecast, by Application 2019 & 2032
- Table 98: Italy Fluid Loss Additive Market Volume (kg/m3) Forecast, by Application 2019 & 2032
- Table 99: Rest of Europe Fluid Loss Additive Market Revenue (Million) Forecast, by Application 2019 & 2032
- Table 100: Rest of Europe Fluid Loss Additive Market Volume (kg/m3) Forecast, by Application 2019 & 2032
- Table 101: Global Fluid Loss Additive Market Revenue Million Forecast, by Additive Type 2019 & 2032
- Table 102: Global Fluid Loss Additive Market Volume kg/m3 Forecast, by Additive Type 2019 & 2032
- Table 103: Global Fluid Loss Additive Market Revenue Million Forecast, by Application 2019 & 2032
- Table 104: Global Fluid Loss Additive Market Volume kg/m3 Forecast, by Application 2019 & 2032
- Table 105: Global Fluid Loss Additive Market Revenue Million Forecast, by Country 2019 & 2032
- Table 106: Global Fluid Loss Additive Market Volume kg/m3 Forecast, by Country 2019 & 2032
- Table 107: Brazil Fluid Loss Additive Market Revenue (Million) Forecast, by Application 2019 & 2032
- Table 108: Brazil Fluid Loss Additive Market Volume (kg/m3) Forecast, by Application 2019 & 2032
- Table 109: Argentina Fluid Loss Additive Market Revenue (Million) Forecast, by Application 2019 & 2032
- Table 110: Argentina Fluid Loss Additive Market Volume (kg/m3) Forecast, by Application 2019 & 2032
- Table 111: Rest of South America Fluid Loss Additive Market Revenue (Million) Forecast, by Application 2019 & 2032
- Table 112: Rest of South America Fluid Loss Additive Market Volume (kg/m3) Forecast, by Application 2019 & 2032
- Table 113: Global Fluid Loss Additive Market Revenue Million Forecast, by Additive Type 2019 & 2032
- Table 114: Global Fluid Loss Additive Market Volume kg/m3 Forecast, by Additive Type 2019 & 2032
- Table 115: Global Fluid Loss Additive Market Revenue Million Forecast, by Application 2019 & 2032
- Table 116: Global Fluid Loss Additive Market Volume kg/m3 Forecast, by Application 2019 & 2032
- Table 117: Global Fluid Loss Additive Market Revenue Million Forecast, by Country 2019 & 2032
- Table 118: Global Fluid Loss Additive Market Volume kg/m3 Forecast, by Country 2019 & 2032
- Table 119: Saudi Arabia Fluid Loss Additive Market Revenue (Million) Forecast, by Application 2019 & 2032
- Table 120: Saudi Arabia Fluid Loss Additive Market Volume (kg/m3) Forecast, by Application 2019 & 2032
- Table 121: South Africa Fluid Loss Additive Market Revenue (Million) Forecast, by Application 2019 & 2032
- Table 122: South Africa Fluid Loss Additive Market Volume (kg/m3) Forecast, by Application 2019 & 2032
- Table 123: Rest of Middle East and Africa Fluid Loss Additive Market Revenue (Million) Forecast, by Application 2019 & 2032
- Table 124: Rest of Middle East and Africa Fluid Loss Additive Market Volume (kg/m3) Forecast, by Application 2019 & 2032
Frequently Asked Questions
1. What is the projected Compound Annual Growth Rate (CAGR) of the Fluid Loss Additive Market?
The projected CAGR is approximately > 3.00%.
2. Which companies are prominent players in the Fluid Loss Additive Market?
Key companies in the market include Clariant, Nouryon, Global Drilling Fluids and Chemicals Limited, Solvay, Newpark Resources Inc, Kemira OYJ, BASF SE, Tytan Organics Pvt Ltd, Halliburton, Schlumberger Limited.
3. What are the main segments of the Fluid Loss Additive Market?
The market segments include Additive Type, Application.
4. Can you provide details about the market size?
The market size is estimated to be USD XX Million as of 2022.
5. What are some drivers contributing to market growth?
; Increase in Shale Gas Exploration; Increasing Investments in the Latest and Unconventional Drilling Technologies.
6. What are the notable trends driving market growth?
Drilling Fluid Application to Dominate the Market.
7. Are there any restraints impacting market growth?
; Growing Demand for Electric Vehicles; Harmful Impact on Environment.
8. Can you provide examples of recent developments in the market?
N/A
9. What pricing options are available for accessing the report?
Pricing options include single-user, multi-user, and enterprise licenses priced at USD 4750, USD 5250, and USD 8750 respectively.
10. Is the market size provided in terms of value or volume?
The market size is provided in terms of value, measured in Million and volume, measured in kg/m3.
11. Are there any specific market keywords associated with the report?
Yes, the market keyword associated with the report is "Fluid Loss Additive Market," which aids in identifying and referencing the specific market segment covered.
12. How do I determine which pricing option suits my needs best?
The pricing options vary based on user requirements and access needs. Individual users may opt for single-user licenses, while businesses requiring broader access may choose multi-user or enterprise licenses for cost-effective access to the report.
13. Are there any additional resources or data provided in the Fluid Loss Additive Market report?
While the report offers comprehensive insights, it's advisable to review the specific contents or supplementary materials provided to ascertain if additional resources or data are available.
14. How can I stay updated on further developments or reports in the Fluid Loss Additive Market?
To stay informed about further developments, trends, and reports in the Fluid Loss Additive Market, consider subscribing to industry newsletters, following relevant companies and organizations, or regularly checking reputable industry news sources and publications.
Methodology
Step 1 - Identification of Relevant Samples Size from Population Database


Step 2 - Approaches for Defining Global Market Size (Value, Volume* & Price*)

Note*: In applicable scenarios
Step 3 - Data Sources
Primary Research
- Web Analytics
- Survey Reports
- Research Institute
- Latest Research Reports
- Opinion Leaders
Secondary Research
- Annual Reports
- White Paper
- Latest Press Release
- Industry Association
- Paid Database
- Investor Presentations

Step 4 - Data Triangulation
Involves using different sources of information in order to increase the validity of a study
These sources are likely to be stakeholders in a program - participants, other researchers, program staff, other community members, and so on.
Then we put all data in single framework & apply various statistical tools to find out the dynamic on the market.
During the analysis stage, feedback from the stakeholder groups would be compared to determine areas of agreement as well as areas of divergence
