

Key Insights
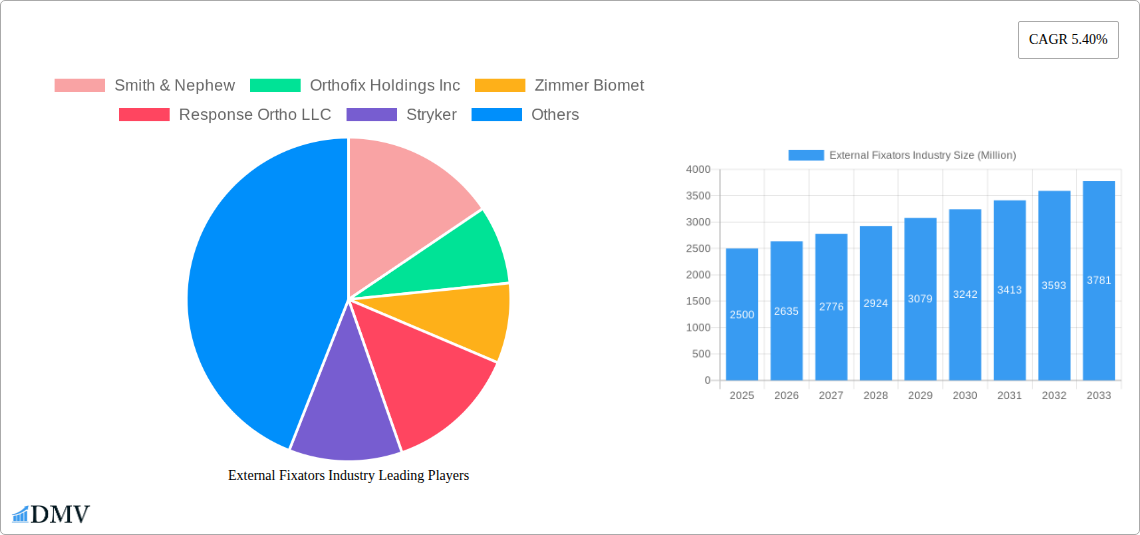
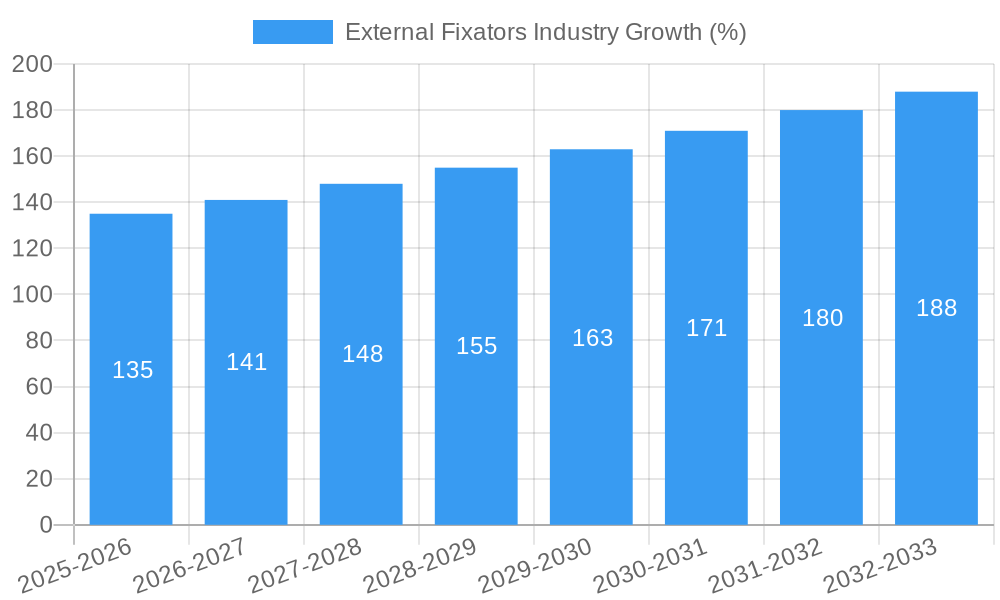
The global external fixators market is experiencing steady growth, projected to maintain a Compound Annual Growth Rate (CAGR) of 5.40% from 2025 to 2033. This expansion is driven by several key factors. The rising incidence of fractures and orthopedic deformities, particularly in aging populations, fuels significant demand for effective fracture management solutions. Technological advancements in external fixation devices, such as the development of computer-aided fixators offering enhanced precision and minimally invasive procedures, are further driving market growth. Increasing adoption of these devices in ambulatory surgical centers and orthopedic and trauma centers, driven by cost-effectiveness and efficiency gains, contributes to market expansion. The diverse applications of external fixators, including fracture fixation, limb correction, and treatment of infected fractures, cater to a wide range of patient needs, boosting market potential. While the market faces constraints like the high cost of advanced fixator systems and potential risks associated with infections, the overall positive trends suggest continued growth. The increasing focus on improving patient outcomes and the development of innovative materials and designs will likely mitigate these challenges. Competition among major players such as Smith & Nephew, Zimmer Biomet, and Stryker is driving innovation and improving product accessibility.
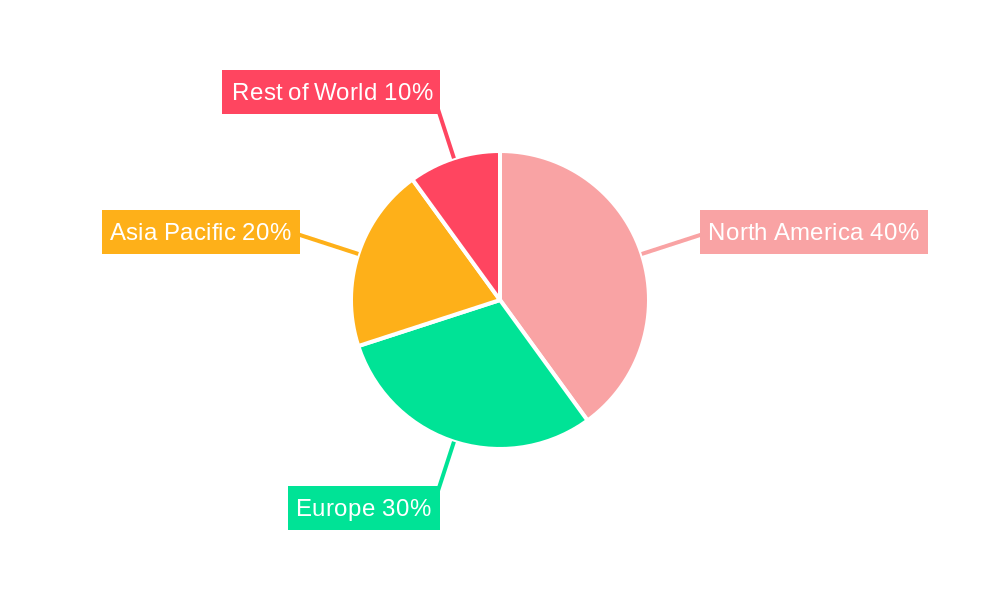
Geographic distribution of the market reveals significant regional variations. North America currently holds a substantial share, owing to high healthcare expenditure and technological advancement. However, the Asia-Pacific region is expected to witness robust growth in the coming years, driven by expanding healthcare infrastructure and rising disposable incomes. Europe and other regions are also poised for moderate growth. The product segment with the largest market share is expected to be computer-aided fixators due to their advantages of higher precision and less invasive procedures. Market segmentation by end-user, application, and fixation type provides a granular understanding of market dynamics. Future market projections indicate a continued positive trajectory, emphasizing the importance of addressing the specific needs of different patient populations and geographical markets to achieve optimal growth.
External Fixators Industry: A Comprehensive Market Report (2019-2033)
This insightful report provides a detailed analysis of the global external fixators market, encompassing market size, segmentation, leading players, and future growth prospects. With a study period spanning 2019-2033, a base year of 2025, and a forecast period of 2025-2033, this report offers crucial insights for stakeholders seeking to understand and capitalize on the opportunities within this dynamic industry. The market is estimated to be worth xx Million in 2025 and is projected to reach xx Million by 2033.
External Fixators Industry Market Composition & Trends
The external fixators market is characterized by a moderately concentrated landscape, with key players like Smith & Nephew, Orthofix Holdings Inc, Zimmer Biomet, and Stryker holding significant market share. Innovation is a key driver, with ongoing advancements in materials science (e.g., carbon fiber), robotic integration, and minimally invasive techniques shaping the market. The regulatory landscape, particularly FDA approvals in the US, significantly influences product adoption and market entry. Substitute products, such as internal fixation devices, represent a competitive challenge. The market is primarily driven by end-users including hospitals, ambulatory surgical centers, and orthopedic and trauma centers. Mergers and acquisitions (M&A) activity plays a significant role in market consolidation and technological integration. For instance, Johnson & Johnson's acquisition of OrthoSpin in 2021 demonstrated the industry's interest in robotic solutions.
- Market Share Distribution (2025): Smith & Nephew (xx%), Zimmer Biomet (xx%), Orthofix Holdings Inc. (xx%), Stryker (xx%), Others (xx%).
- M&A Activity (2019-2024): Total deal value estimated at xx Million, with an average deal size of xx Million.
External Fixators Industry Evolution
The external fixators market has witnessed consistent growth over the historical period (2019-2024), driven by increasing trauma cases, advancements in surgical techniques, and rising prevalence of orthopedic deformities. Technological innovations, such as computer-aided fixators and robotic-assisted systems, are enhancing precision, reducing recovery times, and improving patient outcomes. The market is also experiencing a shift towards minimally invasive procedures, fueled by patient demand for less-invasive surgeries and shorter hospital stays. Growth rates have averaged xx% annually during the historical period, with a projected CAGR of xx% during the forecast period (2025-2033). Adoption of advanced fixator types like circular and hybrid systems is increasing, driven by their superior stability and versatility. The growing geriatric population and increasing incidence of road accidents also contribute to rising demand. The preference for lightweight, comfortable devices is also impacting product development.
Leading Regions, Countries, or Segments in External Fixators Industry
The North American region currently dominates the external fixators market, driven by high healthcare expenditure, advanced medical infrastructure, and a significant number of orthopedic surgeries. Within the segment breakdown, Hospitals represent the largest end-user segment due to their capabilities for complex procedures. Computer-aided fixators are gaining traction due to enhanced precision and reduced surgical time compared to manual fixators. Circular and hybrid fixation types are also preferred due to their superior stability and versatility in managing complex fractures. Fracture fixation constitutes the largest application segment due to the high incidence of bone fractures globally.
- Key Drivers:
- North America: High healthcare spending, advanced medical infrastructure.
- Europe: Rising prevalence of chronic diseases and aging population.
- Hospitals Segment: Capacity for complex procedures and high patient volume.
- Computer-Aided Fixators: Improved precision and reduced surgical times.
- Fracture Fixation Application: High incidence of fractures globally.
External Fixators Industry Product Innovations
Recent innovations in external fixators focus on improved patient comfort, reduced infection risk, and enhanced surgical precision. The introduction of lightweight carbon fiber materials and minimally invasive techniques represent significant advancements. The development of robot-assisted systems improves accuracy during surgery, further enhancing patient outcomes. Unique selling propositions include reduced surgical time, improved stability, and enhanced patient comfort. These innovations are driving market growth and shaping future product development.
Propelling Factors for External Fixators Industry Growth
Several factors fuel the growth of the external fixators market. Technological advancements, such as the development of lightweight, biocompatible materials and minimally invasive surgical techniques, are increasing the adoption of external fixation systems. The growing incidence of trauma and orthopedic deformities, coupled with an aging global population, further drives demand. Favorable regulatory environments, including FDA clearances for innovative products, facilitate market expansion. Government initiatives promoting advanced medical technologies also contribute positively.
Obstacles in the External Fixators Industry Market
Despite the positive growth outlook, the external fixators market faces several challenges. Stringent regulatory approvals and lengthy processes can delay product launches and increase costs. Supply chain disruptions can lead to material shortages and affect production timelines. Intense competition among established players necessitates continuous innovation and differentiation strategies. The cost of external fixation treatment can also limit accessibility in certain regions.
Future Opportunities in External Fixators Industry
Future opportunities lie in developing innovative materials, integrating advanced technologies like AI and machine learning, and expanding into emerging markets. The development of personalized fixation systems tailored to individual patient needs presents a significant opportunity. Focusing on minimally invasive techniques and improving patient outcomes through enhanced comfort and faster recovery times are key areas for future innovation. Expanding into underserved regions with rising orthopedic needs also presents substantial potential.
Major Players in the External Fixators Industry Ecosystem
- Smith & Nephew
- Orthofix Holdings Inc
- Zimmer Biomet
- Response Ortho LLC
- Stryker
- Ortho-SUV Ltd
- Johnson & Johnson (DePuy Synthes)
Key Developments in External Fixators Industry Industry
- March 2022: Orthofix receives USFDA 510(k) clearance for its TrueLok Evo Ring Fixation system, a lightweight carbon fiber device for fracture fixation and deformity correction.
- December 2021: Johnson & Johnson's DePuy Synthes acquires OrthoSpin, a developer of robot-assisted external fixation systems.
Strategic External Fixators Industry Market Forecast
The external fixators market is poised for continued growth, driven by technological advancements, increasing prevalence of orthopedic conditions, and expanding healthcare infrastructure globally. The focus on minimally invasive procedures, personalized medicine, and advanced materials will shape future market trends. The market’s potential for growth is significant, especially in emerging markets with growing healthcare spending. Continued innovation and strategic partnerships will be crucial for companies to maintain a competitive edge and capitalize on future opportunities.
External Fixators Industry Segmentation
-
1. Product Type
- 1.1. Manual Fixators
- 1.2. Computer-Aided Fixators
-
2. Fixation Type
- 2.1. Unilateral and Bilateral
- 2.2. Circular
- 2.3. Hybrid
- 2.4. Others
-
3. Application
- 3.1. Orthopedic Deformities
- 3.2. Fracture Fixation
- 3.3. Infected Fracture
- 3.4. Limb Correction
- 3.5. Other Applications
-
4. End-User
- 4.1. Hospitals
- 4.2. Ambulatory Surgical Centers
- 4.3. Orthopedic and Trauma Centers
External Fixators Industry Segmentation By Geography
-
1. North America
- 1.1. United States
- 1.2. Canada
- 1.3. Mexico
-
2. Europe
- 2.1. Germany
- 2.2. United Kingdom
- 2.3. France
- 2.4. Italy
- 2.5. Spain
- 2.6. Rest of Europe
-
3. Asia Pacific
- 3.1. China
- 3.2. Japan
- 3.3. India
- 3.4. Australia
- 3.5. South Korea
- 3.6. Rest of Asia Pacific
-
4. Middle East and Africa
- 4.1. GCC
- 4.2. South Africa
- 4.3. Rest of Middle East and Africa
-
5. South America
- 5.1. Brazil
- 5.2. Argentina
- 5.3. Rest of South America
External Fixators Industry REPORT HIGHLIGHTS
| Aspects | Details |
|---|---|
| Study Period | 2019-2033 |
| Base Year | 2024 |
| Estimated Year | 2025 |
| Forecast Period | 2025-2033 |
| Historical Period | 2019-2024 |
| Growth Rate | CAGR of 5.40% from 2019-2033 |
| Segmentation |
|
Table of Contents
- 1. Introduction
- 1.1. Research Scope
- 1.2. Market Segmentation
- 1.3. Research Methodology
- 1.4. Definitions and Assumptions
- 2. Executive Summary
- 2.1. Introduction
- 3. Market Dynamics
- 3.1. Introduction
- 3.2. Market Drivers
- 3.2.1 Surging Road Accidents
- 3.2.2 Sports-Related and Other Injuries; Rising Preference for Minimally Invasive Surgeries
- 3.3. Market Restrains
- 3.3.1. Availability of Alternative Treatments in line with the Shortage of Skilled Orthopaedic Surgeons
- 3.4. Market Trends
- 3.4.1. Fracture Fixation is Expected to Witness Significant Growth over the Forecast Period
- 4. Market Factor Analysis
- 4.1. Porters Five Forces
- 4.2. Supply/Value Chain
- 4.3. PESTEL analysis
- 4.4. Market Entropy
- 4.5. Patent/Trademark Analysis
- 5. Global External Fixators Industry Analysis, Insights and Forecast, 2019-2031
- 5.1. Market Analysis, Insights and Forecast - by Product Type
- 5.1.1. Manual Fixators
- 5.1.2. Computer-Aided Fixators
- 5.2. Market Analysis, Insights and Forecast - by Fixation Type
- 5.2.1. Unilateral and Bilateral
- 5.2.2. Circular
- 5.2.3. Hybrid
- 5.2.4. Others
- 5.3. Market Analysis, Insights and Forecast - by Application
- 5.3.1. Orthopedic Deformities
- 5.3.2. Fracture Fixation
- 5.3.3. Infected Fracture
- 5.3.4. Limb Correction
- 5.3.5. Other Applications
- 5.4. Market Analysis, Insights and Forecast - by End-User
- 5.4.1. Hospitals
- 5.4.2. Ambulatory Surgical Centers
- 5.4.3. Orthopedic and Trauma Centers
- 5.5. Market Analysis, Insights and Forecast - by Region
- 5.5.1. North America
- 5.5.2. Europe
- 5.5.3. Asia Pacific
- 5.5.4. Middle East and Africa
- 5.5.5. South America
- 5.1. Market Analysis, Insights and Forecast - by Product Type
- 6. North America External Fixators Industry Analysis, Insights and Forecast, 2019-2031
- 6.1. Market Analysis, Insights and Forecast - by Product Type
- 6.1.1. Manual Fixators
- 6.1.2. Computer-Aided Fixators
- 6.2. Market Analysis, Insights and Forecast - by Fixation Type
- 6.2.1. Unilateral and Bilateral
- 6.2.2. Circular
- 6.2.3. Hybrid
- 6.2.4. Others
- 6.3. Market Analysis, Insights and Forecast - by Application
- 6.3.1. Orthopedic Deformities
- 6.3.2. Fracture Fixation
- 6.3.3. Infected Fracture
- 6.3.4. Limb Correction
- 6.3.5. Other Applications
- 6.4. Market Analysis, Insights and Forecast - by End-User
- 6.4.1. Hospitals
- 6.4.2. Ambulatory Surgical Centers
- 6.4.3. Orthopedic and Trauma Centers
- 6.1. Market Analysis, Insights and Forecast - by Product Type
- 7. Europe External Fixators Industry Analysis, Insights and Forecast, 2019-2031
- 7.1. Market Analysis, Insights and Forecast - by Product Type
- 7.1.1. Manual Fixators
- 7.1.2. Computer-Aided Fixators
- 7.2. Market Analysis, Insights and Forecast - by Fixation Type
- 7.2.1. Unilateral and Bilateral
- 7.2.2. Circular
- 7.2.3. Hybrid
- 7.2.4. Others
- 7.3. Market Analysis, Insights and Forecast - by Application
- 7.3.1. Orthopedic Deformities
- 7.3.2. Fracture Fixation
- 7.3.3. Infected Fracture
- 7.3.4. Limb Correction
- 7.3.5. Other Applications
- 7.4. Market Analysis, Insights and Forecast - by End-User
- 7.4.1. Hospitals
- 7.4.2. Ambulatory Surgical Centers
- 7.4.3. Orthopedic and Trauma Centers
- 7.1. Market Analysis, Insights and Forecast - by Product Type
- 8. Asia Pacific External Fixators Industry Analysis, Insights and Forecast, 2019-2031
- 8.1. Market Analysis, Insights and Forecast - by Product Type
- 8.1.1. Manual Fixators
- 8.1.2. Computer-Aided Fixators
- 8.2. Market Analysis, Insights and Forecast - by Fixation Type
- 8.2.1. Unilateral and Bilateral
- 8.2.2. Circular
- 8.2.3. Hybrid
- 8.2.4. Others
- 8.3. Market Analysis, Insights and Forecast - by Application
- 8.3.1. Orthopedic Deformities
- 8.3.2. Fracture Fixation
- 8.3.3. Infected Fracture
- 8.3.4. Limb Correction
- 8.3.5. Other Applications
- 8.4. Market Analysis, Insights and Forecast - by End-User
- 8.4.1. Hospitals
- 8.4.2. Ambulatory Surgical Centers
- 8.4.3. Orthopedic and Trauma Centers
- 8.1. Market Analysis, Insights and Forecast - by Product Type
- 9. Middle East and Africa External Fixators Industry Analysis, Insights and Forecast, 2019-2031
- 9.1. Market Analysis, Insights and Forecast - by Product Type
- 9.1.1. Manual Fixators
- 9.1.2. Computer-Aided Fixators
- 9.2. Market Analysis, Insights and Forecast - by Fixation Type
- 9.2.1. Unilateral and Bilateral
- 9.2.2. Circular
- 9.2.3. Hybrid
- 9.2.4. Others
- 9.3. Market Analysis, Insights and Forecast - by Application
- 9.3.1. Orthopedic Deformities
- 9.3.2. Fracture Fixation
- 9.3.3. Infected Fracture
- 9.3.4. Limb Correction
- 9.3.5. Other Applications
- 9.4. Market Analysis, Insights and Forecast - by End-User
- 9.4.1. Hospitals
- 9.4.2. Ambulatory Surgical Centers
- 9.4.3. Orthopedic and Trauma Centers
- 9.1. Market Analysis, Insights and Forecast - by Product Type
- 10. South America External Fixators Industry Analysis, Insights and Forecast, 2019-2031
- 10.1. Market Analysis, Insights and Forecast - by Product Type
- 10.1.1. Manual Fixators
- 10.1.2. Computer-Aided Fixators
- 10.2. Market Analysis, Insights and Forecast - by Fixation Type
- 10.2.1. Unilateral and Bilateral
- 10.2.2. Circular
- 10.2.3. Hybrid
- 10.2.4. Others
- 10.3. Market Analysis, Insights and Forecast - by Application
- 10.3.1. Orthopedic Deformities
- 10.3.2. Fracture Fixation
- 10.3.3. Infected Fracture
- 10.3.4. Limb Correction
- 10.3.5. Other Applications
- 10.4. Market Analysis, Insights and Forecast - by End-User
- 10.4.1. Hospitals
- 10.4.2. Ambulatory Surgical Centers
- 10.4.3. Orthopedic and Trauma Centers
- 10.1. Market Analysis, Insights and Forecast - by Product Type
- 11. North America External Fixators Industry Analysis, Insights and Forecast, 2019-2031
- 11.1. Market Analysis, Insights and Forecast - By Country/Sub-region
- 11.1.1 United States
- 11.1.2 Canada
- 11.1.3 Mexico
- 12. Europe External Fixators Industry Analysis, Insights and Forecast, 2019-2031
- 12.1. Market Analysis, Insights and Forecast - By Country/Sub-region
- 12.1.1 Germany
- 12.1.2 United Kingdom
- 12.1.3 France
- 12.1.4 Italy
- 12.1.5 Spain
- 12.1.6 Rest of Europe
- 13. Asia Pacific External Fixators Industry Analysis, Insights and Forecast, 2019-2031
- 13.1. Market Analysis, Insights and Forecast - By Country/Sub-region
- 13.1.1 China
- 13.1.2 Japan
- 13.1.3 India
- 13.1.4 Australia
- 13.1.5 South Korea
- 13.1.6 Rest of Asia Pacific
- 14. Middle East and Africa External Fixators Industry Analysis, Insights and Forecast, 2019-2031
- 14.1. Market Analysis, Insights and Forecast - By Country/Sub-region
- 14.1.1 GCC
- 14.1.2 South Africa
- 14.1.3 Rest of Middle East and Africa
- 15. South America External Fixators Industry Analysis, Insights and Forecast, 2019-2031
- 15.1. Market Analysis, Insights and Forecast - By Country/Sub-region
- 15.1.1 Brazil
- 15.1.2 Argentina
- 15.1.3 Rest of South America
- 16. Competitive Analysis
- 16.1. Global Market Share Analysis 2024
- 16.2. Company Profiles
- 16.2.1 Smith & Nephew
- 16.2.1.1. Overview
- 16.2.1.2. Products
- 16.2.1.3. SWOT Analysis
- 16.2.1.4. Recent Developments
- 16.2.1.5. Financials (Based on Availability)
- 16.2.2 Orthofix Holdings Inc
- 16.2.2.1. Overview
- 16.2.2.2. Products
- 16.2.2.3. SWOT Analysis
- 16.2.2.4. Recent Developments
- 16.2.2.5. Financials (Based on Availability)
- 16.2.3 Zimmer Biomet
- 16.2.3.1. Overview
- 16.2.3.2. Products
- 16.2.3.3. SWOT Analysis
- 16.2.3.4. Recent Developments
- 16.2.3.5. Financials (Based on Availability)
- 16.2.4 Response Ortho LLC
- 16.2.4.1. Overview
- 16.2.4.2. Products
- 16.2.4.3. SWOT Analysis
- 16.2.4.4. Recent Developments
- 16.2.4.5. Financials (Based on Availability)
- 16.2.5 Stryker
- 16.2.5.1. Overview
- 16.2.5.2. Products
- 16.2.5.3. SWOT Analysis
- 16.2.5.4. Recent Developments
- 16.2.5.5. Financials (Based on Availability)
- 16.2.6 Ortho-SUV Ltd
- 16.2.6.1. Overview
- 16.2.6.2. Products
- 16.2.6.3. SWOT Analysis
- 16.2.6.4. Recent Developments
- 16.2.6.5. Financials (Based on Availability)
- 16.2.7 Johnson & Johnson (DePuy Synthes)
- 16.2.7.1. Overview
- 16.2.7.2. Products
- 16.2.7.3. SWOT Analysis
- 16.2.7.4. Recent Developments
- 16.2.7.5. Financials (Based on Availability)
- 16.2.1 Smith & Nephew
List of Figures
- Figure 1: Global External Fixators Industry Revenue Breakdown (Million, %) by Region 2024 & 2032
- Figure 2: North America External Fixators Industry Revenue (Million), by Country 2024 & 2032
- Figure 3: North America External Fixators Industry Revenue Share (%), by Country 2024 & 2032
- Figure 4: Europe External Fixators Industry Revenue (Million), by Country 2024 & 2032
- Figure 5: Europe External Fixators Industry Revenue Share (%), by Country 2024 & 2032
- Figure 6: Asia Pacific External Fixators Industry Revenue (Million), by Country 2024 & 2032
- Figure 7: Asia Pacific External Fixators Industry Revenue Share (%), by Country 2024 & 2032
- Figure 8: Middle East and Africa External Fixators Industry Revenue (Million), by Country 2024 & 2032
- Figure 9: Middle East and Africa External Fixators Industry Revenue Share (%), by Country 2024 & 2032
- Figure 10: South America External Fixators Industry Revenue (Million), by Country 2024 & 2032
- Figure 11: South America External Fixators Industry Revenue Share (%), by Country 2024 & 2032
- Figure 12: North America External Fixators Industry Revenue (Million), by Product Type 2024 & 2032
- Figure 13: North America External Fixators Industry Revenue Share (%), by Product Type 2024 & 2032
- Figure 14: North America External Fixators Industry Revenue (Million), by Fixation Type 2024 & 2032
- Figure 15: North America External Fixators Industry Revenue Share (%), by Fixation Type 2024 & 2032
- Figure 16: North America External Fixators Industry Revenue (Million), by Application 2024 & 2032
- Figure 17: North America External Fixators Industry Revenue Share (%), by Application 2024 & 2032
- Figure 18: North America External Fixators Industry Revenue (Million), by End-User 2024 & 2032
- Figure 19: North America External Fixators Industry Revenue Share (%), by End-User 2024 & 2032
- Figure 20: North America External Fixators Industry Revenue (Million), by Country 2024 & 2032
- Figure 21: North America External Fixators Industry Revenue Share (%), by Country 2024 & 2032
- Figure 22: Europe External Fixators Industry Revenue (Million), by Product Type 2024 & 2032
- Figure 23: Europe External Fixators Industry Revenue Share (%), by Product Type 2024 & 2032
- Figure 24: Europe External Fixators Industry Revenue (Million), by Fixation Type 2024 & 2032
- Figure 25: Europe External Fixators Industry Revenue Share (%), by Fixation Type 2024 & 2032
- Figure 26: Europe External Fixators Industry Revenue (Million), by Application 2024 & 2032
- Figure 27: Europe External Fixators Industry Revenue Share (%), by Application 2024 & 2032
- Figure 28: Europe External Fixators Industry Revenue (Million), by End-User 2024 & 2032
- Figure 29: Europe External Fixators Industry Revenue Share (%), by End-User 2024 & 2032
- Figure 30: Europe External Fixators Industry Revenue (Million), by Country 2024 & 2032
- Figure 31: Europe External Fixators Industry Revenue Share (%), by Country 2024 & 2032
- Figure 32: Asia Pacific External Fixators Industry Revenue (Million), by Product Type 2024 & 2032
- Figure 33: Asia Pacific External Fixators Industry Revenue Share (%), by Product Type 2024 & 2032
- Figure 34: Asia Pacific External Fixators Industry Revenue (Million), by Fixation Type 2024 & 2032
- Figure 35: Asia Pacific External Fixators Industry Revenue Share (%), by Fixation Type 2024 & 2032
- Figure 36: Asia Pacific External Fixators Industry Revenue (Million), by Application 2024 & 2032
- Figure 37: Asia Pacific External Fixators Industry Revenue Share (%), by Application 2024 & 2032
- Figure 38: Asia Pacific External Fixators Industry Revenue (Million), by End-User 2024 & 2032
- Figure 39: Asia Pacific External Fixators Industry Revenue Share (%), by End-User 2024 & 2032
- Figure 40: Asia Pacific External Fixators Industry Revenue (Million), by Country 2024 & 2032
- Figure 41: Asia Pacific External Fixators Industry Revenue Share (%), by Country 2024 & 2032
- Figure 42: Middle East and Africa External Fixators Industry Revenue (Million), by Product Type 2024 & 2032
- Figure 43: Middle East and Africa External Fixators Industry Revenue Share (%), by Product Type 2024 & 2032
- Figure 44: Middle East and Africa External Fixators Industry Revenue (Million), by Fixation Type 2024 & 2032
- Figure 45: Middle East and Africa External Fixators Industry Revenue Share (%), by Fixation Type 2024 & 2032
- Figure 46: Middle East and Africa External Fixators Industry Revenue (Million), by Application 2024 & 2032
- Figure 47: Middle East and Africa External Fixators Industry Revenue Share (%), by Application 2024 & 2032
- Figure 48: Middle East and Africa External Fixators Industry Revenue (Million), by End-User 2024 & 2032
- Figure 49: Middle East and Africa External Fixators Industry Revenue Share (%), by End-User 2024 & 2032
- Figure 50: Middle East and Africa External Fixators Industry Revenue (Million), by Country 2024 & 2032
- Figure 51: Middle East and Africa External Fixators Industry Revenue Share (%), by Country 2024 & 2032
- Figure 52: South America External Fixators Industry Revenue (Million), by Product Type 2024 & 2032
- Figure 53: South America External Fixators Industry Revenue Share (%), by Product Type 2024 & 2032
- Figure 54: South America External Fixators Industry Revenue (Million), by Fixation Type 2024 & 2032
- Figure 55: South America External Fixators Industry Revenue Share (%), by Fixation Type 2024 & 2032
- Figure 56: South America External Fixators Industry Revenue (Million), by Application 2024 & 2032
- Figure 57: South America External Fixators Industry Revenue Share (%), by Application 2024 & 2032
- Figure 58: South America External Fixators Industry Revenue (Million), by End-User 2024 & 2032
- Figure 59: South America External Fixators Industry Revenue Share (%), by End-User 2024 & 2032
- Figure 60: South America External Fixators Industry Revenue (Million), by Country 2024 & 2032
- Figure 61: South America External Fixators Industry Revenue Share (%), by Country 2024 & 2032
List of Tables
- Table 1: Global External Fixators Industry Revenue Million Forecast, by Region 2019 & 2032
- Table 2: Global External Fixators Industry Revenue Million Forecast, by Product Type 2019 & 2032
- Table 3: Global External Fixators Industry Revenue Million Forecast, by Fixation Type 2019 & 2032
- Table 4: Global External Fixators Industry Revenue Million Forecast, by Application 2019 & 2032
- Table 5: Global External Fixators Industry Revenue Million Forecast, by End-User 2019 & 2032
- Table 6: Global External Fixators Industry Revenue Million Forecast, by Region 2019 & 2032
- Table 7: Global External Fixators Industry Revenue Million Forecast, by Country 2019 & 2032
- Table 8: United States External Fixators Industry Revenue (Million) Forecast, by Application 2019 & 2032
- Table 9: Canada External Fixators Industry Revenue (Million) Forecast, by Application 2019 & 2032
- Table 10: Mexico External Fixators Industry Revenue (Million) Forecast, by Application 2019 & 2032
- Table 11: Global External Fixators Industry Revenue Million Forecast, by Country 2019 & 2032
- Table 12: Germany External Fixators Industry Revenue (Million) Forecast, by Application 2019 & 2032
- Table 13: United Kingdom External Fixators Industry Revenue (Million) Forecast, by Application 2019 & 2032
- Table 14: France External Fixators Industry Revenue (Million) Forecast, by Application 2019 & 2032
- Table 15: Italy External Fixators Industry Revenue (Million) Forecast, by Application 2019 & 2032
- Table 16: Spain External Fixators Industry Revenue (Million) Forecast, by Application 2019 & 2032
- Table 17: Rest of Europe External Fixators Industry Revenue (Million) Forecast, by Application 2019 & 2032
- Table 18: Global External Fixators Industry Revenue Million Forecast, by Country 2019 & 2032
- Table 19: China External Fixators Industry Revenue (Million) Forecast, by Application 2019 & 2032
- Table 20: Japan External Fixators Industry Revenue (Million) Forecast, by Application 2019 & 2032
- Table 21: India External Fixators Industry Revenue (Million) Forecast, by Application 2019 & 2032
- Table 22: Australia External Fixators Industry Revenue (Million) Forecast, by Application 2019 & 2032
- Table 23: South Korea External Fixators Industry Revenue (Million) Forecast, by Application 2019 & 2032
- Table 24: Rest of Asia Pacific External Fixators Industry Revenue (Million) Forecast, by Application 2019 & 2032
- Table 25: Global External Fixators Industry Revenue Million Forecast, by Country 2019 & 2032
- Table 26: GCC External Fixators Industry Revenue (Million) Forecast, by Application 2019 & 2032
- Table 27: South Africa External Fixators Industry Revenue (Million) Forecast, by Application 2019 & 2032
- Table 28: Rest of Middle East and Africa External Fixators Industry Revenue (Million) Forecast, by Application 2019 & 2032
- Table 29: Global External Fixators Industry Revenue Million Forecast, by Country 2019 & 2032
- Table 30: Brazil External Fixators Industry Revenue (Million) Forecast, by Application 2019 & 2032
- Table 31: Argentina External Fixators Industry Revenue (Million) Forecast, by Application 2019 & 2032
- Table 32: Rest of South America External Fixators Industry Revenue (Million) Forecast, by Application 2019 & 2032
- Table 33: Global External Fixators Industry Revenue Million Forecast, by Product Type 2019 & 2032
- Table 34: Global External Fixators Industry Revenue Million Forecast, by Fixation Type 2019 & 2032
- Table 35: Global External Fixators Industry Revenue Million Forecast, by Application 2019 & 2032
- Table 36: Global External Fixators Industry Revenue Million Forecast, by End-User 2019 & 2032
- Table 37: Global External Fixators Industry Revenue Million Forecast, by Country 2019 & 2032
- Table 38: United States External Fixators Industry Revenue (Million) Forecast, by Application 2019 & 2032
- Table 39: Canada External Fixators Industry Revenue (Million) Forecast, by Application 2019 & 2032
- Table 40: Mexico External Fixators Industry Revenue (Million) Forecast, by Application 2019 & 2032
- Table 41: Global External Fixators Industry Revenue Million Forecast, by Product Type 2019 & 2032
- Table 42: Global External Fixators Industry Revenue Million Forecast, by Fixation Type 2019 & 2032
- Table 43: Global External Fixators Industry Revenue Million Forecast, by Application 2019 & 2032
- Table 44: Global External Fixators Industry Revenue Million Forecast, by End-User 2019 & 2032
- Table 45: Global External Fixators Industry Revenue Million Forecast, by Country 2019 & 2032
- Table 46: Germany External Fixators Industry Revenue (Million) Forecast, by Application 2019 & 2032
- Table 47: United Kingdom External Fixators Industry Revenue (Million) Forecast, by Application 2019 & 2032
- Table 48: France External Fixators Industry Revenue (Million) Forecast, by Application 2019 & 2032
- Table 49: Italy External Fixators Industry Revenue (Million) Forecast, by Application 2019 & 2032
- Table 50: Spain External Fixators Industry Revenue (Million) Forecast, by Application 2019 & 2032
- Table 51: Rest of Europe External Fixators Industry Revenue (Million) Forecast, by Application 2019 & 2032
- Table 52: Global External Fixators Industry Revenue Million Forecast, by Product Type 2019 & 2032
- Table 53: Global External Fixators Industry Revenue Million Forecast, by Fixation Type 2019 & 2032
- Table 54: Global External Fixators Industry Revenue Million Forecast, by Application 2019 & 2032
- Table 55: Global External Fixators Industry Revenue Million Forecast, by End-User 2019 & 2032
- Table 56: Global External Fixators Industry Revenue Million Forecast, by Country 2019 & 2032
- Table 57: China External Fixators Industry Revenue (Million) Forecast, by Application 2019 & 2032
- Table 58: Japan External Fixators Industry Revenue (Million) Forecast, by Application 2019 & 2032
- Table 59: India External Fixators Industry Revenue (Million) Forecast, by Application 2019 & 2032
- Table 60: Australia External Fixators Industry Revenue (Million) Forecast, by Application 2019 & 2032
- Table 61: South Korea External Fixators Industry Revenue (Million) Forecast, by Application 2019 & 2032
- Table 62: Rest of Asia Pacific External Fixators Industry Revenue (Million) Forecast, by Application 2019 & 2032
- Table 63: Global External Fixators Industry Revenue Million Forecast, by Product Type 2019 & 2032
- Table 64: Global External Fixators Industry Revenue Million Forecast, by Fixation Type 2019 & 2032
- Table 65: Global External Fixators Industry Revenue Million Forecast, by Application 2019 & 2032
- Table 66: Global External Fixators Industry Revenue Million Forecast, by End-User 2019 & 2032
- Table 67: Global External Fixators Industry Revenue Million Forecast, by Country 2019 & 2032
- Table 68: GCC External Fixators Industry Revenue (Million) Forecast, by Application 2019 & 2032
- Table 69: South Africa External Fixators Industry Revenue (Million) Forecast, by Application 2019 & 2032
- Table 70: Rest of Middle East and Africa External Fixators Industry Revenue (Million) Forecast, by Application 2019 & 2032
- Table 71: Global External Fixators Industry Revenue Million Forecast, by Product Type 2019 & 2032
- Table 72: Global External Fixators Industry Revenue Million Forecast, by Fixation Type 2019 & 2032
- Table 73: Global External Fixators Industry Revenue Million Forecast, by Application 2019 & 2032
- Table 74: Global External Fixators Industry Revenue Million Forecast, by End-User 2019 & 2032
- Table 75: Global External Fixators Industry Revenue Million Forecast, by Country 2019 & 2032
- Table 76: Brazil External Fixators Industry Revenue (Million) Forecast, by Application 2019 & 2032
- Table 77: Argentina External Fixators Industry Revenue (Million) Forecast, by Application 2019 & 2032
- Table 78: Rest of South America External Fixators Industry Revenue (Million) Forecast, by Application 2019 & 2032
Frequently Asked Questions
1. What is the projected Compound Annual Growth Rate (CAGR) of the External Fixators Industry?
The projected CAGR is approximately 5.40%.
2. Which companies are prominent players in the External Fixators Industry?
Key companies in the market include Smith & Nephew, Orthofix Holdings Inc, Zimmer Biomet, Response Ortho LLC, Stryker, Ortho-SUV Ltd, Johnson & Johnson (DePuy Synthes).
3. What are the main segments of the External Fixators Industry?
The market segments include Product Type, Fixation Type, Application, End-User.
4. Can you provide details about the market size?
The market size is estimated to be USD XX Million as of 2022.
5. What are some drivers contributing to market growth?
Surging Road Accidents. Sports-Related and Other Injuries; Rising Preference for Minimally Invasive Surgeries.
6. What are the notable trends driving market growth?
Fracture Fixation is Expected to Witness Significant Growth over the Forecast Period.
7. Are there any restraints impacting market growth?
Availability of Alternative Treatments in line with the Shortage of Skilled Orthopaedic Surgeons.
8. Can you provide examples of recent developments in the market?
In March 2022, Orthofix announced that it received United States Food and Drug Administration (USFDA) 510(k) clearance for its TrueLok Evo Ring Fixation system. TrueLok is an advanced external fixation system made of carbon fiber to create a lightweight device for patient comfort and it is interred for fixation of open and closed fractures, and correction of bony or soft tissue defects or deformities in adults and pediatric patients.
9. What pricing options are available for accessing the report?
Pricing options include single-user, multi-user, and enterprise licenses priced at USD 4750, USD 5250, and USD 8750 respectively.
10. Is the market size provided in terms of value or volume?
The market size is provided in terms of value, measured in Million.
11. Are there any specific market keywords associated with the report?
Yes, the market keyword associated with the report is "External Fixators Industry," which aids in identifying and referencing the specific market segment covered.
12. How do I determine which pricing option suits my needs best?
The pricing options vary based on user requirements and access needs. Individual users may opt for single-user licenses, while businesses requiring broader access may choose multi-user or enterprise licenses for cost-effective access to the report.
13. Are there any additional resources or data provided in the External Fixators Industry report?
While the report offers comprehensive insights, it's advisable to review the specific contents or supplementary materials provided to ascertain if additional resources or data are available.
14. How can I stay updated on further developments or reports in the External Fixators Industry?
To stay informed about further developments, trends, and reports in the External Fixators Industry, consider subscribing to industry newsletters, following relevant companies and organizations, or regularly checking reputable industry news sources and publications.
Methodology
Step 1 - Identification of Relevant Samples Size from Population Database


Step 2 - Approaches for Defining Global Market Size (Value, Volume* & Price*)

Note*: In applicable scenarios
Step 3 - Data Sources
Primary Research
- Web Analytics
- Survey Reports
- Research Institute
- Latest Research Reports
- Opinion Leaders
Secondary Research
- Annual Reports
- White Paper
- Latest Press Release
- Industry Association
- Paid Database
- Investor Presentations

Step 4 - Data Triangulation
Involves using different sources of information in order to increase the validity of a study
These sources are likely to be stakeholders in a program - participants, other researchers, program staff, other community members, and so on.
Then we put all data in single framework & apply various statistical tools to find out the dynamic on the market.
During the analysis stage, feedback from the stakeholder groups would be compared to determine areas of agreement as well as areas of divergence
