

Key Insights
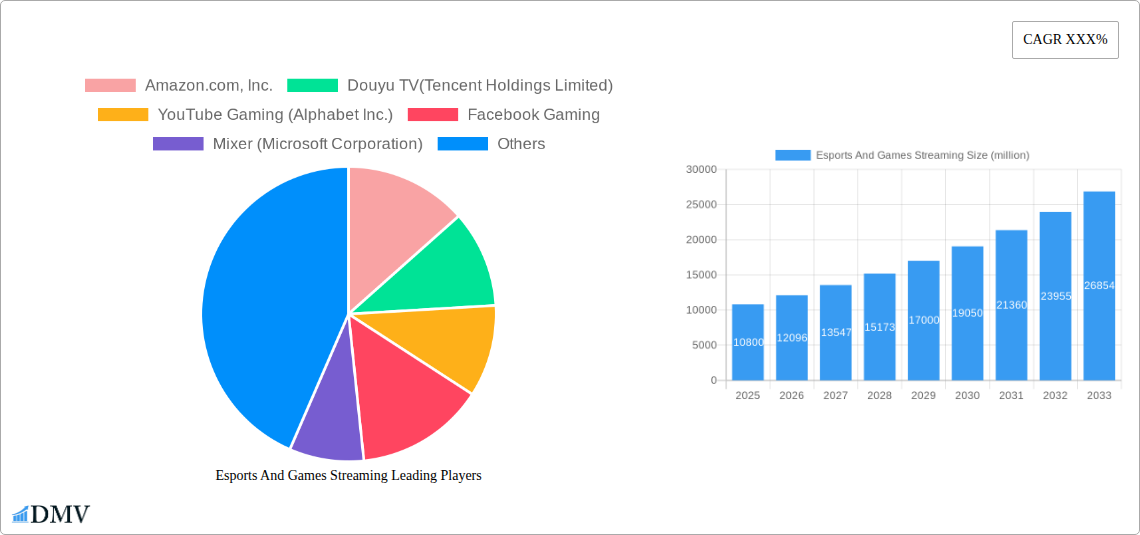
The global Esports and Games Streaming market is poised for significant expansion, projected to reach approximately $10,800 million by 2025, with an anticipated Compound Annual Growth Rate (CAGR) of around 12% during the forecast period of 2025-2033. This robust growth is fueled by a confluence of factors, including the escalating popularity of esports tournaments, the increasing adoption of high-speed internet infrastructure, and the continuous innovation in streaming technology. The accessibility and engagement offered by platforms like YouTube Gaming and Twitch have democratized viewership, transforming casual gamers into passionate followers and creating lucrative opportunities for content creators. Moreover, the integration of social features and interactive elements within these platforms further enhances user retention and community building, driving sustained engagement. The burgeoning esports ecosystem, with its professional leagues, celebrity endorsements, and substantial prize pools, is a major catalyst, attracting both players and viewers. The widespread availability of smartphones and affordable internet plans, particularly in emerging economies, is also broadening the reach of games streaming to a wider demographic.
The market is segmented across various applications, with a pronounced dominance of the 'Business' segment, indicating significant corporate investment and sponsorship in esports and streaming. This is further supported by the prevalence of 'Web-Based' streaming solutions, offering broad accessibility and platform independence. However, the 'APP Based' segment is expected to witness accelerated growth, driven by the proliferation of mobile gaming and dedicated streaming applications that offer tailored user experiences. Key players such as Amazon.com, Inc. (Twitch), Douyu TV (Tencent Holdings Limited), YouTube Gaming (Alphabet Inc.), and Facebook Gaming are actively shaping the market landscape through strategic partnerships, content acquisition, and technological advancements. Restraints such as the high cost of bandwidth and the potential for market saturation in certain regions are present, but the overarching trends of increasing digital connectivity, a growing youth population engaged with gaming, and the continuous evolution of immersive entertainment experiences are expected to propel the market forward. The Asia Pacific region, particularly China and India, is emerging as a dominant force due to its massive gaming population and rapid digital adoption.
Certainly, here is the SEO-optimized and insightful report description for Esports And Games Streaming, designed for immediate use without modification.
The esports and games streaming market is a dynamic and rapidly evolving ecosystem, characterized by a moderate to high degree of concentration among key players and significant innovation catalysts driving its expansion. Major companies such as Amazon.com, Inc. (Twitch), Douyu TV (Tencent Holdings Limited), YouTube Gaming (Alphabet Inc.), Facebook Gaming, and Mixer (Microsoft Corporation) dominate significant market share, influencing content creation, platform development, and user engagement strategies. The competitive landscape is further shaped by the constant influx of new technologies and platform features aimed at enhancing viewer experience and creator monetization. Regulatory landscapes, while still developing, are increasingly focusing on issues like content moderation, intellectual property rights, and fair competition, impacting platform operations and business models. Substitute products, including traditional sports broadcasting and other forms of online video entertainment, present a constant challenge, necessitating continuous innovation in the gaming and esports vertical. End-user profiles are diverse, encompassing a broad spectrum of demographics, from casual viewers to dedicated esports enthusiasts and professional gamers, each with unique consumption habits and preferences. Mergers and acquisitions (M&A) activities have played a crucial role in market consolidation and strategic expansion, with deal values reaching several hundred million dollars annually. For instance, in the historical period of 2019-2024, M&A transactions in the broader gaming and streaming sector have cumulatively amounted to an estimated $300 million to $500 million annually, indicative of strategic investments and consolidation efforts. The market share distribution among the top platforms is highly competitive, with Twitch often leading in active viewership, followed closely by YouTube Gaming, demonstrating a fluid and contested market.
Esports And Games Streaming Industry Evolution
The esports and games streaming industry has witnessed a remarkable trajectory of growth and transformation throughout the study period, from 2019 to 2033. The historical period of 2019-2024 laid a strong foundation, characterized by exponential increases in viewership and revenue. During this time, the global esports and games streaming market experienced an average annual growth rate of approximately 15-20%, driven by increasing internet penetration, the proliferation of affordable streaming devices, and a growing global appetite for competitive gaming content. This robust growth was significantly fueled by technological advancements. The widespread adoption of high-speed internet infrastructure, improvements in video compression technologies, and the rise of mobile streaming capabilities have democratized access to both content creation and consumption. Furthermore, the integration of interactive features, such as real-time chat, polls, and personalized recommendations, has enhanced user engagement, transforming passive viewing into an immersive experience.
Shifting consumer demands have been a pivotal factor in the industry's evolution. Viewers are no longer content with just watching gameplay; they seek authentic interactions with streamers, behind-the-scenes content, and opportunities to participate directly. This has led to a surge in demand for personality-driven content, live Q&A sessions, and community-building events. The rise of esports tournaments, with their professional athletes, high production values, and massive prize pools, has also been a significant growth catalyst, attracting both dedicated fans and casual observers. The estimated year of 2025 marks a period of continued acceleration, with projected growth rates for the esports and games streaming market expected to remain strong at around 12-17% annually. This sustained growth is underpinned by the increasing professionalization of esports, the expansion into new geographic markets, and the development of more sophisticated monetization models for both platforms and creators. Adoption metrics continue to climb, with active monthly users across major platforms projected to reach hundreds of millions globally. The market is increasingly segmented, with specialized content catering to specific game genres and viewer preferences, further solidifying its position as a mainstream entertainment force.
Leading Regions, Countries, or Segments in Esports And Games Streaming
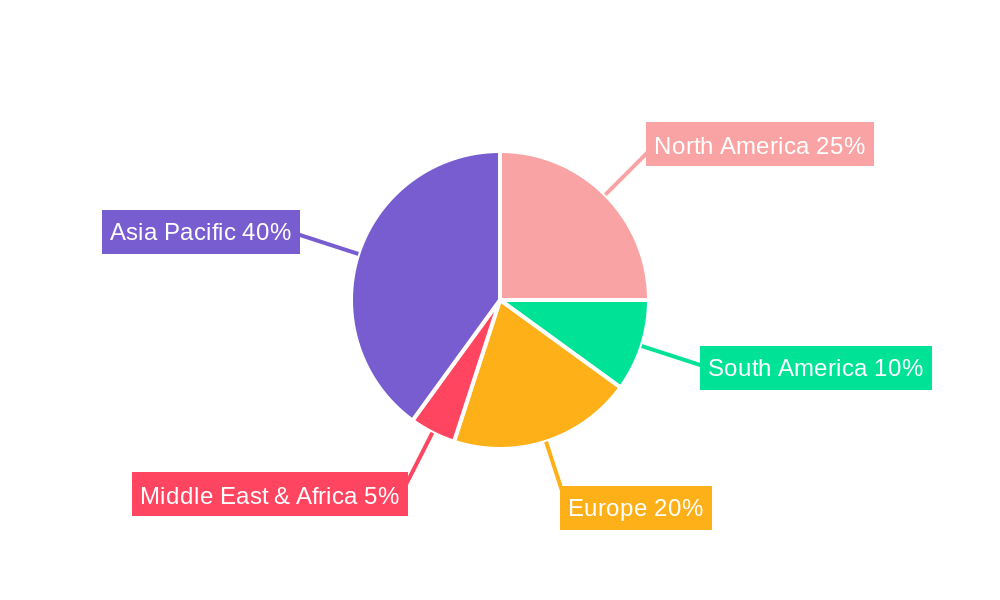
The esports and games streaming market exhibits significant regional variations in dominance, driven by a confluence of factors including digital infrastructure, cultural affinity for gaming, and economic development. While specific regional dominance can fluctuate, North America and Asia-Pacific consistently emerge as leading regions. Within the Application segment, the Residential application overwhelmingly dominates the market, accounting for an estimated 70-75% of total viewership and revenue in 2025. This is driven by the pervasive nature of gaming as a home-based entertainment activity, with individuals and families investing in gaming consoles, PCs, and mobile devices for leisure. The Business application, encompassing esports organizations, tournament organizers, and gaming companies utilizing streaming for marketing and engagement, represents a significant but smaller segment, estimated at 25-30% of the market.
In terms of Type, the market is experiencing a dual dominance, with both Web-Based and APP Based platforms commanding substantial user bases. Web-based platforms, accessible via browsers, offer convenience and broad accessibility, while APP-based platforms, often optimized for mobile and console gaming, provide a more integrated and feature-rich experience. By 2025, it is projected that Web Based streaming will account for approximately 50-55% of the market share, with APP Based streaming closely following at 45-50%. Key drivers for this dominance include significant investment trends in both content creation and infrastructure within these leading regions. For instance, in the Asia-Pacific region, particularly in countries like China and South Korea, government support for the gaming industry and widespread mobile adoption have propelled the growth of gaming and esports streaming. In North America, substantial venture capital funding and a highly engaged consumer base have fueled the expansion of platforms like Twitch. Regulatory support, while varied, generally favors the growth of digital media and entertainment in these areas. The dominance factors are multifaceted. In North America, the presence of major esports leagues and a culture that embraces competitive gaming contribute significantly. Asia-Pacific's dominance is bolstered by a massive population, a strong mobile-first approach to technology, and a burgeoning esports scene, particularly in Southeast Asia and China. The sheer volume of active gamers and viewers in these regions, coupled with increasing disposable income for entertainment, solidifies their leading positions.
Esports And Games Streaming Product Innovations
Product innovations in esports and games streaming are continuously reshaping the user experience and monetization potential. Advanced streaming technologies, including AI-powered content moderation, personalized recommendation engines, and low-latency streaming solutions, are becoming standard. Mobile-first streaming platforms and in-app purchasing integration have significantly enhanced accessibility and revenue generation for creators. Unique selling propositions often revolve around exclusive content rights, interactive features like live polls and gamified chat, and robust community-building tools that foster deeper engagement between streamers and their audience. Technological advancements are focused on improving video quality, reducing buffering, and offering immersive viewing experiences, such as 360-degree streams and VR integration.
Propelling Factors for Esports And Games Streaming Growth
Several key growth drivers are propelling the esports and games streaming market forward. Technological advancements are paramount, with the proliferation of high-speed internet, 5G deployment, and improved streaming codecs significantly enhancing content delivery and viewer experience. Economic factors, including increasing disposable incomes and the growing popularity of gaming as a mainstream entertainment choice, are driving consumer spending on gaming hardware, subscriptions, and in-stream purchases. Regulatory support in many regions, which is increasingly recognizing esports and gaming as legitimate industries, further fosters investment and growth. The professionalization of esports, with organized leagues, major tournaments, and substantial prize pools, is attracting a wider audience and generating significant media attention. Furthermore, the creator economy model, empowering individuals to monetize their passion through subscriptions, donations, and sponsorships, incentivizes a constant flow of engaging content.
Obstacles in the Esports And Games Streaming Market
Despite its rapid growth, the esports and games streaming market faces several significant obstacles. Regulatory challenges remain a concern, with evolving guidelines around content moderation, advertising, and player protection in different jurisdictions creating complexity for global platforms. Supply chain disruptions, particularly for gaming hardware and related equipment, can impact consumer access and delay the adoption of new technologies. Intense competitive pressures among established platforms and emerging players necessitate continuous investment in content, technology, and user acquisition, leading to high operational costs. Additionally, monetization challenges, such as ad fatigue, the sustainability of subscription models, and the reliance on a relatively small percentage of highly engaged viewers for substantial revenue, present ongoing hurdles. The potential for market saturation in certain segments also poses a risk to sustained growth.
Future Opportunities in Esports And Games Streaming
Emerging opportunities in the esports and games streaming market are abundant and diverse. The expansion into emerging markets in South America, Africa, and Southeast Asia presents a vast untapped audience with growing digital access. New technologies like augmented reality (AR) and virtual reality (VR) offer the potential for truly immersive viewing experiences, blurring the lines between spectator and participant. The increasing convergence of esports and traditional entertainment, with celebrity involvement and crossover content, opens new avenues for audience engagement. Furthermore, the development of decentralized streaming platforms utilizing blockchain technology could offer greater transparency and creator control. The growing interest in esports education and training platforms also represents a significant growth area.
Major Players in the Esports And Games Streaming Ecosystem
- Amazon.com, Inc.
- Douyu TV (Tencent Holdings Limited)
- YouTube Gaming (Alphabet Inc.)
- Facebook Gaming
- Mixer (Microsoft Corporation)
Key Developments in Esports And Games Streaming Industry
- 2019: Significant increase in mobile esports tournament viewership, driven by the accessibility of mobile gaming.
- 2020: Explosive growth in general gaming and streaming viewership due to global lockdowns, leading to platform infrastructure strain and investment in capacity.
- 2021: Major publishers launch their own dedicated streaming platforms or invest heavily in existing ones to control content distribution and monetize directly.
- 2022: Increased focus on creator monetization tools and partnerships, with platforms offering enhanced revenue-sharing models and support for emerging streamers.
- 2023: Advancements in AI for content moderation and personalized recommendations become more prominent, aiming to improve user safety and engagement.
- 2024: Growing investment in VR/AR streaming technologies, with initial experimental broadcasts of major esports events for immersive viewing.
Strategic Esports And Games Streaming Market Forecast
The strategic esports and games streaming market forecast remains overwhelmingly positive, fueled by persistent growth catalysts. The continued global expansion of internet infrastructure, coupled with the increasing adoption of mobile devices and high-speed connectivity, will unlock new consumer bases. The ongoing professionalization of esports, attracting significant investment and media coverage, will further solidify its mainstream appeal. Emerging technologies like AI-driven content personalization and the nascent integration of VR/AR offer exciting prospects for enhanced viewer engagement and novel monetization avenues. The market's inherent adaptability to evolving consumer preferences, combined with the robust creator economy, ensures a steady stream of compelling content. Projections indicate sustained double-digit growth through the forecast period, with an estimated market value expected to reach tens of billions of dollars by 2033, underscoring its immense potential.
Esports And Games Streaming Segmentation
-
1. Application
- 1.1. Business
- 1.2. Residential
-
2. Type
- 2.1. Web Based
- 2.2. APP Based
Esports And Games Streaming Segmentation By Geography
-
1. North America
- 1.1. United States
- 1.2. Canada
- 1.3. Mexico
-
2. South America
- 2.1. Brazil
- 2.2. Argentina
- 2.3. Rest of South America
-
3. Europe
- 3.1. United Kingdom
- 3.2. Germany
- 3.3. France
- 3.4. Italy
- 3.5. Spain
- 3.6. Russia
- 3.7. Benelux
- 3.8. Nordics
- 3.9. Rest of Europe
-
4. Middle East & Africa
- 4.1. Turkey
- 4.2. Israel
- 4.3. GCC
- 4.4. North Africa
- 4.5. South Africa
- 4.6. Rest of Middle East & Africa
-
5. Asia Pacific
- 5.1. China
- 5.2. India
- 5.3. Japan
- 5.4. South Korea
- 5.5. ASEAN
- 5.6. Oceania
- 5.7. Rest of Asia Pacific
Esports And Games Streaming REPORT HIGHLIGHTS
| Aspects | Details |
|---|---|
| Study Period | 2019-2033 |
| Base Year | 2024 |
| Estimated Year | 2025 |
| Forecast Period | 2025-2033 |
| Historical Period | 2019-2024 |
| Growth Rate | CAGR of XXX% from 2019-2033 |
| Segmentation |
|
Table of Contents
- 1. Introduction
- 1.1. Research Scope
- 1.2. Market Segmentation
- 1.3. Research Methodology
- 1.4. Definitions and Assumptions
- 2. Executive Summary
- 2.1. Introduction
- 3. Market Dynamics
- 3.1. Introduction
- 3.2. Market Drivers
- 3.3. Market Restrains
- 3.4. Market Trends
- 4. Market Factor Analysis
- 4.1. Porters Five Forces
- 4.2. Supply/Value Chain
- 4.3. PESTEL analysis
- 4.4. Market Entropy
- 4.5. Patent/Trademark Analysis
- 5. Global Esports And Games Streaming Analysis, Insights and Forecast, 2019-2031
- 5.1. Market Analysis, Insights and Forecast - by Application
- 5.1.1. Business
- 5.1.2. Residential
- 5.2. Market Analysis, Insights and Forecast - by Type
- 5.2.1. Web Based
- 5.2.2. APP Based
- 5.3. Market Analysis, Insights and Forecast - by Region
- 5.3.1. North America
- 5.3.2. South America
- 5.3.3. Europe
- 5.3.4. Middle East & Africa
- 5.3.5. Asia Pacific
- 5.1. Market Analysis, Insights and Forecast - by Application
- 6. North America Esports And Games Streaming Analysis, Insights and Forecast, 2019-2031
- 6.1. Market Analysis, Insights and Forecast - by Application
- 6.1.1. Business
- 6.1.2. Residential
- 6.2. Market Analysis, Insights and Forecast - by Type
- 6.2.1. Web Based
- 6.2.2. APP Based
- 6.1. Market Analysis, Insights and Forecast - by Application
- 7. South America Esports And Games Streaming Analysis, Insights and Forecast, 2019-2031
- 7.1. Market Analysis, Insights and Forecast - by Application
- 7.1.1. Business
- 7.1.2. Residential
- 7.2. Market Analysis, Insights and Forecast - by Type
- 7.2.1. Web Based
- 7.2.2. APP Based
- 7.1. Market Analysis, Insights and Forecast - by Application
- 8. Europe Esports And Games Streaming Analysis, Insights and Forecast, 2019-2031
- 8.1. Market Analysis, Insights and Forecast - by Application
- 8.1.1. Business
- 8.1.2. Residential
- 8.2. Market Analysis, Insights and Forecast - by Type
- 8.2.1. Web Based
- 8.2.2. APP Based
- 8.1. Market Analysis, Insights and Forecast - by Application
- 9. Middle East & Africa Esports And Games Streaming Analysis, Insights and Forecast, 2019-2031
- 9.1. Market Analysis, Insights and Forecast - by Application
- 9.1.1. Business
- 9.1.2. Residential
- 9.2. Market Analysis, Insights and Forecast - by Type
- 9.2.1. Web Based
- 9.2.2. APP Based
- 9.1. Market Analysis, Insights and Forecast - by Application
- 10. Asia Pacific Esports And Games Streaming Analysis, Insights and Forecast, 2019-2031
- 10.1. Market Analysis, Insights and Forecast - by Application
- 10.1.1. Business
- 10.1.2. Residential
- 10.2. Market Analysis, Insights and Forecast - by Type
- 10.2.1. Web Based
- 10.2.2. APP Based
- 10.1. Market Analysis, Insights and Forecast - by Application
- 11. Competitive Analysis
- 11.1. Global Market Share Analysis 2024
- 11.2. Company Profiles
- 11.2.1 Amazon.com Inc.
- 11.2.1.1. Overview
- 11.2.1.2. Products
- 11.2.1.3. SWOT Analysis
- 11.2.1.4. Recent Developments
- 11.2.1.5. Financials (Based on Availability)
- 11.2.2 Douyu TV(Tencent Holdings Limited)
- 11.2.2.1. Overview
- 11.2.2.2. Products
- 11.2.2.3. SWOT Analysis
- 11.2.2.4. Recent Developments
- 11.2.2.5. Financials (Based on Availability)
- 11.2.3 YouTube Gaming (Alphabet Inc.)
- 11.2.3.1. Overview
- 11.2.3.2. Products
- 11.2.3.3. SWOT Analysis
- 11.2.3.4. Recent Developments
- 11.2.3.5. Financials (Based on Availability)
- 11.2.4 Facebook Gaming
- 11.2.4.1. Overview
- 11.2.4.2. Products
- 11.2.4.3. SWOT Analysis
- 11.2.4.4. Recent Developments
- 11.2.4.5. Financials (Based on Availability)
- 11.2.5 Mixer (Microsoft Corporation)
- 11.2.5.1. Overview
- 11.2.5.2. Products
- 11.2.5.3. SWOT Analysis
- 11.2.5.4. Recent Developments
- 11.2.5.5. Financials (Based on Availability)
- 11.2.1 Amazon.com Inc.
List of Figures
- Figure 1: Global Esports And Games Streaming Revenue Breakdown (million, %) by Region 2024 & 2032
- Figure 2: North America Esports And Games Streaming Revenue (million), by Application 2024 & 2032
- Figure 3: North America Esports And Games Streaming Revenue Share (%), by Application 2024 & 2032
- Figure 4: North America Esports And Games Streaming Revenue (million), by Type 2024 & 2032
- Figure 5: North America Esports And Games Streaming Revenue Share (%), by Type 2024 & 2032
- Figure 6: North America Esports And Games Streaming Revenue (million), by Country 2024 & 2032
- Figure 7: North America Esports And Games Streaming Revenue Share (%), by Country 2024 & 2032
- Figure 8: South America Esports And Games Streaming Revenue (million), by Application 2024 & 2032
- Figure 9: South America Esports And Games Streaming Revenue Share (%), by Application 2024 & 2032
- Figure 10: South America Esports And Games Streaming Revenue (million), by Type 2024 & 2032
- Figure 11: South America Esports And Games Streaming Revenue Share (%), by Type 2024 & 2032
- Figure 12: South America Esports And Games Streaming Revenue (million), by Country 2024 & 2032
- Figure 13: South America Esports And Games Streaming Revenue Share (%), by Country 2024 & 2032
- Figure 14: Europe Esports And Games Streaming Revenue (million), by Application 2024 & 2032
- Figure 15: Europe Esports And Games Streaming Revenue Share (%), by Application 2024 & 2032
- Figure 16: Europe Esports And Games Streaming Revenue (million), by Type 2024 & 2032
- Figure 17: Europe Esports And Games Streaming Revenue Share (%), by Type 2024 & 2032
- Figure 18: Europe Esports And Games Streaming Revenue (million), by Country 2024 & 2032
- Figure 19: Europe Esports And Games Streaming Revenue Share (%), by Country 2024 & 2032
- Figure 20: Middle East & Africa Esports And Games Streaming Revenue (million), by Application 2024 & 2032
- Figure 21: Middle East & Africa Esports And Games Streaming Revenue Share (%), by Application 2024 & 2032
- Figure 22: Middle East & Africa Esports And Games Streaming Revenue (million), by Type 2024 & 2032
- Figure 23: Middle East & Africa Esports And Games Streaming Revenue Share (%), by Type 2024 & 2032
- Figure 24: Middle East & Africa Esports And Games Streaming Revenue (million), by Country 2024 & 2032
- Figure 25: Middle East & Africa Esports And Games Streaming Revenue Share (%), by Country 2024 & 2032
- Figure 26: Asia Pacific Esports And Games Streaming Revenue (million), by Application 2024 & 2032
- Figure 27: Asia Pacific Esports And Games Streaming Revenue Share (%), by Application 2024 & 2032
- Figure 28: Asia Pacific Esports And Games Streaming Revenue (million), by Type 2024 & 2032
- Figure 29: Asia Pacific Esports And Games Streaming Revenue Share (%), by Type 2024 & 2032
- Figure 30: Asia Pacific Esports And Games Streaming Revenue (million), by Country 2024 & 2032
- Figure 31: Asia Pacific Esports And Games Streaming Revenue Share (%), by Country 2024 & 2032
List of Tables
- Table 1: Global Esports And Games Streaming Revenue million Forecast, by Region 2019 & 2032
- Table 2: Global Esports And Games Streaming Revenue million Forecast, by Application 2019 & 2032
- Table 3: Global Esports And Games Streaming Revenue million Forecast, by Type 2019 & 2032
- Table 4: Global Esports And Games Streaming Revenue million Forecast, by Region 2019 & 2032
- Table 5: Global Esports And Games Streaming Revenue million Forecast, by Application 2019 & 2032
- Table 6: Global Esports And Games Streaming Revenue million Forecast, by Type 2019 & 2032
- Table 7: Global Esports And Games Streaming Revenue million Forecast, by Country 2019 & 2032
- Table 8: United States Esports And Games Streaming Revenue (million) Forecast, by Application 2019 & 2032
- Table 9: Canada Esports And Games Streaming Revenue (million) Forecast, by Application 2019 & 2032
- Table 10: Mexico Esports And Games Streaming Revenue (million) Forecast, by Application 2019 & 2032
- Table 11: Global Esports And Games Streaming Revenue million Forecast, by Application 2019 & 2032
- Table 12: Global Esports And Games Streaming Revenue million Forecast, by Type 2019 & 2032
- Table 13: Global Esports And Games Streaming Revenue million Forecast, by Country 2019 & 2032
- Table 14: Brazil Esports And Games Streaming Revenue (million) Forecast, by Application 2019 & 2032
- Table 15: Argentina Esports And Games Streaming Revenue (million) Forecast, by Application 2019 & 2032
- Table 16: Rest of South America Esports And Games Streaming Revenue (million) Forecast, by Application 2019 & 2032
- Table 17: Global Esports And Games Streaming Revenue million Forecast, by Application 2019 & 2032
- Table 18: Global Esports And Games Streaming Revenue million Forecast, by Type 2019 & 2032
- Table 19: Global Esports And Games Streaming Revenue million Forecast, by Country 2019 & 2032
- Table 20: United Kingdom Esports And Games Streaming Revenue (million) Forecast, by Application 2019 & 2032
- Table 21: Germany Esports And Games Streaming Revenue (million) Forecast, by Application 2019 & 2032
- Table 22: France Esports And Games Streaming Revenue (million) Forecast, by Application 2019 & 2032
- Table 23: Italy Esports And Games Streaming Revenue (million) Forecast, by Application 2019 & 2032
- Table 24: Spain Esports And Games Streaming Revenue (million) Forecast, by Application 2019 & 2032
- Table 25: Russia Esports And Games Streaming Revenue (million) Forecast, by Application 2019 & 2032
- Table 26: Benelux Esports And Games Streaming Revenue (million) Forecast, by Application 2019 & 2032
- Table 27: Nordics Esports And Games Streaming Revenue (million) Forecast, by Application 2019 & 2032
- Table 28: Rest of Europe Esports And Games Streaming Revenue (million) Forecast, by Application 2019 & 2032
- Table 29: Global Esports And Games Streaming Revenue million Forecast, by Application 2019 & 2032
- Table 30: Global Esports And Games Streaming Revenue million Forecast, by Type 2019 & 2032
- Table 31: Global Esports And Games Streaming Revenue million Forecast, by Country 2019 & 2032
- Table 32: Turkey Esports And Games Streaming Revenue (million) Forecast, by Application 2019 & 2032
- Table 33: Israel Esports And Games Streaming Revenue (million) Forecast, by Application 2019 & 2032
- Table 34: GCC Esports And Games Streaming Revenue (million) Forecast, by Application 2019 & 2032
- Table 35: North Africa Esports And Games Streaming Revenue (million) Forecast, by Application 2019 & 2032
- Table 36: South Africa Esports And Games Streaming Revenue (million) Forecast, by Application 2019 & 2032
- Table 37: Rest of Middle East & Africa Esports And Games Streaming Revenue (million) Forecast, by Application 2019 & 2032
- Table 38: Global Esports And Games Streaming Revenue million Forecast, by Application 2019 & 2032
- Table 39: Global Esports And Games Streaming Revenue million Forecast, by Type 2019 & 2032
- Table 40: Global Esports And Games Streaming Revenue million Forecast, by Country 2019 & 2032
- Table 41: China Esports And Games Streaming Revenue (million) Forecast, by Application 2019 & 2032
- Table 42: India Esports And Games Streaming Revenue (million) Forecast, by Application 2019 & 2032
- Table 43: Japan Esports And Games Streaming Revenue (million) Forecast, by Application 2019 & 2032
- Table 44: South Korea Esports And Games Streaming Revenue (million) Forecast, by Application 2019 & 2032
- Table 45: ASEAN Esports And Games Streaming Revenue (million) Forecast, by Application 2019 & 2032
- Table 46: Oceania Esports And Games Streaming Revenue (million) Forecast, by Application 2019 & 2032
- Table 47: Rest of Asia Pacific Esports And Games Streaming Revenue (million) Forecast, by Application 2019 & 2032
Frequently Asked Questions
1. What is the projected Compound Annual Growth Rate (CAGR) of the Esports And Games Streaming?
The projected CAGR is approximately XXX%.
2. Which companies are prominent players in the Esports And Games Streaming?
Key companies in the market include Amazon.com, Inc., Douyu TV(Tencent Holdings Limited), YouTube Gaming (Alphabet Inc.), Facebook Gaming, Mixer (Microsoft Corporation).
3. What are the main segments of the Esports And Games Streaming?
The market segments include Application, Type.
4. Can you provide details about the market size?
The market size is estimated to be USD XXX million as of 2022.
5. What are some drivers contributing to market growth?
N/A
6. What are the notable trends driving market growth?
N/A
7. Are there any restraints impacting market growth?
N/A
8. Can you provide examples of recent developments in the market?
N/A
9. What pricing options are available for accessing the report?
Pricing options include single-user, multi-user, and enterprise licenses priced at USD 2900.00, USD 4350.00, and USD 5800.00 respectively.
10. Is the market size provided in terms of value or volume?
The market size is provided in terms of value, measured in million.
11. Are there any specific market keywords associated with the report?
Yes, the market keyword associated with the report is "Esports And Games Streaming," which aids in identifying and referencing the specific market segment covered.
12. How do I determine which pricing option suits my needs best?
The pricing options vary based on user requirements and access needs. Individual users may opt for single-user licenses, while businesses requiring broader access may choose multi-user or enterprise licenses for cost-effective access to the report.
13. Are there any additional resources or data provided in the Esports And Games Streaming report?
While the report offers comprehensive insights, it's advisable to review the specific contents or supplementary materials provided to ascertain if additional resources or data are available.
14. How can I stay updated on further developments or reports in the Esports And Games Streaming?
To stay informed about further developments, trends, and reports in the Esports And Games Streaming, consider subscribing to industry newsletters, following relevant companies and organizations, or regularly checking reputable industry news sources and publications.
Methodology
Step 1 - Identification of Relevant Samples Size from Population Database


Step 2 - Approaches for Defining Global Market Size (Value, Volume* & Price*)

Note*: In applicable scenarios
Step 3 - Data Sources
Primary Research
- Web Analytics
- Survey Reports
- Research Institute
- Latest Research Reports
- Opinion Leaders
Secondary Research
- Annual Reports
- White Paper
- Latest Press Release
- Industry Association
- Paid Database
- Investor Presentations

Step 4 - Data Triangulation
Involves using different sources of information in order to increase the validity of a study
These sources are likely to be stakeholders in a program - participants, other researchers, program staff, other community members, and so on.
Then we put all data in single framework & apply various statistical tools to find out the dynamic on the market.
During the analysis stage, feedback from the stakeholder groups would be compared to determine areas of agreement as well as areas of divergence
