

Key Insights
The global data center cabinet rack market is projected to reach $5.17 billion by 2025, expanding at a Compound Annual Growth Rate (CAGR) of 12.7% from 2025 to 2033. This significant growth is driven by the escalating adoption of cloud computing and big data analytics, demanding enhanced data center infrastructure. The rise of edge computing, enabling localized data processing, and stringent data security mandates further propel market expansion. Leading industry players are innovating with advanced solutions focused on superior cooling, power management, and modularity. Strategic collaborations and competitive pricing models are also influencing market trends.
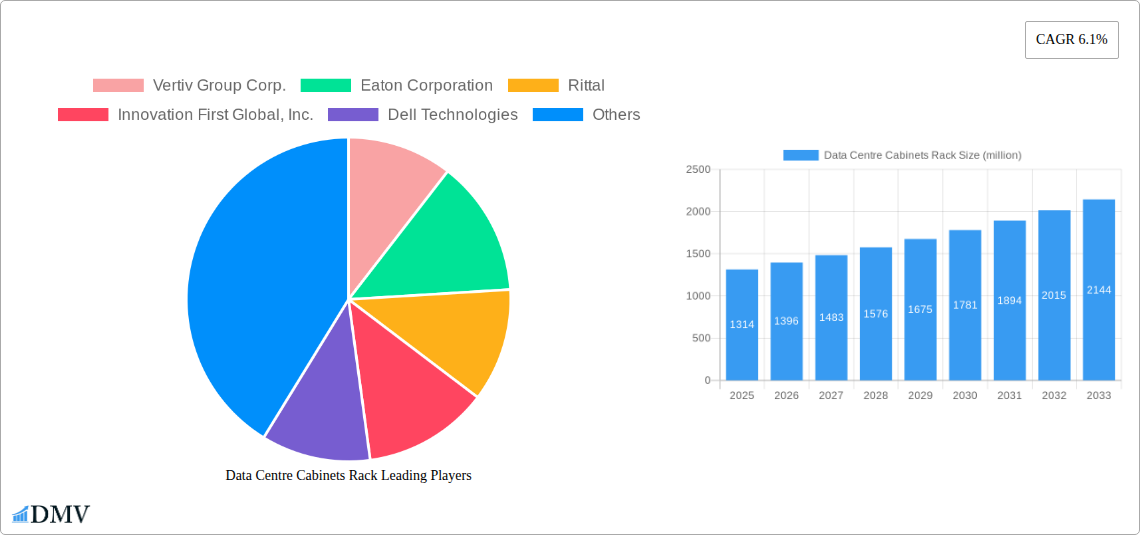
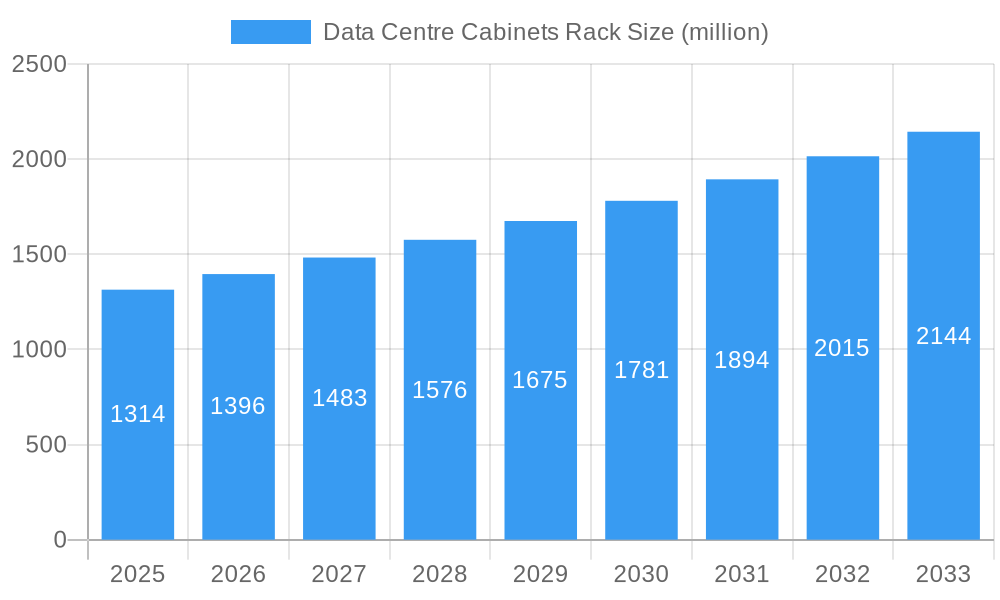
Data Centre Cabinets Rack Market Size (In Billion)
Despite positive growth prospects, the market encounters challenges. High upfront investment costs for advanced cabinet racks can be a barrier for smaller enterprises. The rapid pace of technological evolution in data centers introduces concerns about product obsolescence. Fluctuations in raw material prices also impact production costs and pricing strategies. Nevertheless, the persistent growth of the digital economy and the increasing global demand for resilient data center infrastructure ensure a favorable long-term outlook for the data center cabinet rack market. Market segmentation is expected to encompass variations in size, features (e.g., cooling, power distribution), material composition, and regional adoption rates.
Data Centre Cabinets Rack Company Market Share
Data Centre Cabinets Rack Market: A Comprehensive Report (2019-2033)
This insightful report provides a detailed analysis of the global Data Centre Cabinets Rack market, projecting a multi-million dollar valuation by 2033. It meticulously examines market dynamics, technological advancements, and competitive landscapes, offering invaluable insights for stakeholders across the value chain. The study period spans 2019-2033, with 2025 serving as both the base and estimated year, and the forecast period covering 2025-2033. The historical period analyzed is 2019-2024. Key players like Vertiv Group Corp., Eaton Corporation, Rittal, and others are profiled, providing a comprehensive understanding of this rapidly evolving market.
Data Centre Cabinets Rack Market Composition & Trends
This section delves into the intricate composition of the Data Centre Cabinets Rack market, evaluating its concentration, innovation drivers, regulatory frameworks, and competitive dynamics. We analyze the market share distribution among key players like Vertiv Group Corp., Eaton Corporation, and Rittal, revealing a xx% market concentration in 2025. The report further examines the impact of technological advancements, such as AI-powered cooling systems and modular designs, on market growth. Furthermore, it explores the influence of regulatory compliance standards, the availability of substitute products, and evolving end-user preferences (e.g., hyperscale data centers, cloud providers) on market trajectories. Finally, we analyze the impact of significant M&A activities, including deal values exceeding $xx million in the last five years, on market consolidation and future strategies.
- Market Concentration: xx% in 2025, dominated by Vertiv, Eaton, and Rittal.
- Innovation Catalysts: AI-powered cooling, modular design, enhanced security features.
- Regulatory Landscape: Compliance with xx standards driving product innovation.
- Substitute Products: Limited viable alternatives, maintaining market stability.
- End-User Profiles: Hyperscale data centers, cloud providers, enterprise businesses.
- M&A Activities: Over $xx million in deal value over the past five years, impacting market consolidation.
Data Centre Cabinets Rack Industry Evolution
This section presents a comprehensive analysis of the Data Centre Cabinets Rack industry's evolution, examining market growth trajectories from 2019 to 2033. We project a Compound Annual Growth Rate (CAGR) of xx% during the forecast period (2025-2033), driven by the burgeoning demand for data storage and processing globally. The report tracks technological advancements in cabinet design, materials, and cooling systems, highlighting the increasing adoption of sustainable and energy-efficient solutions. The analysis also assesses the influence of shifting consumer demands, such as increased capacity requirements and improved power efficiency, on industry trends. Specific adoption metrics for new technologies, such as xx, are included, providing quantitative insights into market evolution. The increasing reliance on cloud services and the rise of edge computing contribute significantly to the market's expansion.
Leading Regions, Countries, or Segments in Data Centre Cabinets Rack
The report identifies [Region/Country - e.g., North America] as the leading region in the Data Centre Cabinets Rack market in 2025, holding a market share of xx%. This dominance is attributed to several key factors:
- High Investment in Data Centers: Significant investments in data center infrastructure are driving demand.
- Stringent Regulatory Support: Favorable government policies promoting digital transformation.
- Presence of Major Players: Concentration of leading vendors fosters innovation and competition.
- Advanced Technological Infrastructure: Robust digital infrastructure facilitates rapid adoption.
Further detailed analysis showcases the underlying factors contributing to the region's dominance, examining specific market segments and their growth potentials. The report also details the competitive landscape within this leading region, analyzing market share dynamics and the strategies employed by major players.
Data Centre Cabinets Rack Product Innovations
Recent innovations in Data Centre Cabinets Rack design encompass enhanced cooling systems incorporating AI-powered management, improved cable management solutions for increased efficiency, and the integration of advanced monitoring technologies. These advancements offer unique selling propositions such as reduced energy consumption, improved airflow, and enhanced security, leading to better performance metrics like reduced downtime and improved data center efficiency. The shift towards modular and adaptable rack designs enables greater flexibility and scalability to meet evolving data center needs.
Propelling Factors for Data Centre Cabinets Rack Growth
The Data Centre Cabinets Rack market's expansion is driven by several factors: the exponential growth of data globally, necessitating more robust storage and processing capacity; increasing adoption of cloud computing and edge computing; and the rising demand for high-performance computing across various sectors. Furthermore, government initiatives promoting digital infrastructure development are significantly boosting market growth. The ongoing expansion of the global 5G network further enhances market demand for advanced data center solutions.
Obstacles in the Data Centre Cabinets Rack Market
Significant challenges include supply chain disruptions, impacting the availability of raw materials and components. This issue is exacerbated by geopolitical instability and trade restrictions, leading to increased production costs and delivery delays. Furthermore, intense competition among established players and the emergence of new entrants create pricing pressure. Finally, stringent regulatory compliance requirements necessitate substantial investments in product development and testing, impacting profitability.
Future Opportunities in Data Centre Cabinets Rack
Future opportunities lie in the expansion of 5G networks and the growth of the Internet of Things (IoT), fueling demand for innovative data center solutions. The increasing adoption of sustainable and energy-efficient technologies presents significant opportunities for eco-conscious data center operators. Furthermore, the emergence of new markets in developing economies offers significant growth potential.
Major Players in the Data Centre Cabinets Rack Ecosystem
- Vertiv Group Corp.
- Eaton Corporation
- Rittal
- Innovation First Global, Inc.
- Dell Technologies
- Schneider Electric
- Oracle
- Legrand
- Sysracks
- GOMA ELETTRONICA SpA
Key Developments in Data Centre Cabinets Rack Industry
- 2022 Q4: Vertiv launched its next-generation Liebert DBC cooling system.
- 2023 Q1: Eaton announced a strategic partnership with xx to expand its data center solutions.
- 2023 Q2: Rittal introduced its innovative modular data center solution, enhancing scalability and flexibility. (Further developments will be added based on data availability)
Strategic Data Centre Cabinets Rack Market Forecast
The Data Centre Cabinets Rack market is poised for substantial growth over the forecast period, driven by the aforementioned technological advancements, increased demand from cloud providers and hyperscale data centers, and favorable regulatory environments. The market is expected to witness significant innovation in cooling technologies, rack design, and integration with AI-powered management systems, further propelling growth. The expansion into new geographic markets and the rising adoption of sustainable solutions will also contribute to this upward trajectory.
Data Centre Cabinets Rack Segmentation
-
1. Application
- 1.1. Banking, Financial Services and Insurance (BFSI)
- 1.2. IT and Telecom
- 1.3. Government and Defense
- 1.4. Healthcare
- 1.5. Energy and Utilities
- 1.6. Manufacturing and Retail
- 1.7. Others
-
2. Type
- 2.1. 42U and Below
- 2.2. 43U to 52U
- 2.3. Above 52U
Data Centre Cabinets Rack Segmentation By Geography
-
1. North America
- 1.1. United States
- 1.2. Canada
- 1.3. Mexico
-
2. South America
- 2.1. Brazil
- 2.2. Argentina
- 2.3. Rest of South America
-
3. Europe
- 3.1. United Kingdom
- 3.2. Germany
- 3.3. France
- 3.4. Italy
- 3.5. Spain
- 3.6. Russia
- 3.7. Benelux
- 3.8. Nordics
- 3.9. Rest of Europe
-
4. Middle East & Africa
- 4.1. Turkey
- 4.2. Israel
- 4.3. GCC
- 4.4. North Africa
- 4.5. South Africa
- 4.6. Rest of Middle East & Africa
-
5. Asia Pacific
- 5.1. China
- 5.2. India
- 5.3. Japan
- 5.4. South Korea
- 5.5. ASEAN
- 5.6. Oceania
- 5.7. Rest of Asia Pacific
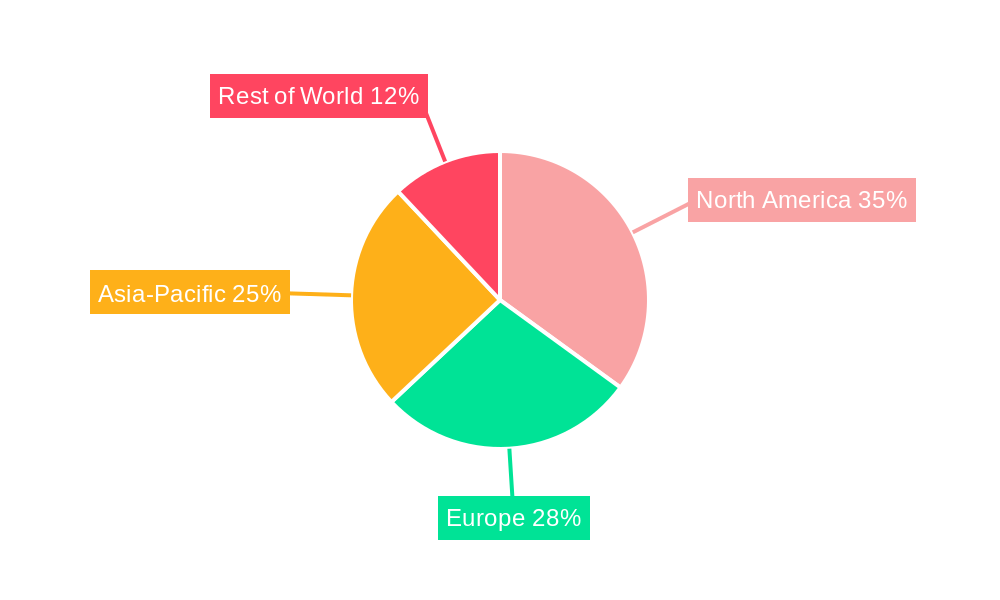
Data Centre Cabinets Rack Regional Market Share
Geographic Coverage of Data Centre Cabinets Rack
Data Centre Cabinets Rack REPORT HIGHLIGHTS
| Aspects | Details |
|---|---|
| Study Period | 2020-2034 |
| Base Year | 2025 |
| Estimated Year | 2026 |
| Forecast Period | 2026-2034 |
| Historical Period | 2020-2025 |
| Growth Rate | CAGR of 12.7% from 2020-2034 |
| Segmentation |
|
Table of Contents
- 1. Introduction
- 1.1. Research Scope
- 1.2. Market Segmentation
- 1.3. Research Objective
- 1.4. Definitions and Assumptions
- 2. Executive Summary
- 2.1. Market Snapshot
- 3. Market Dynamics
- 3.1. Market Drivers
- 3.2. Market Restrains
- 3.3. Market Trends
- 3.4. Market Opportunities
- 4. Market Factor Analysis
- 4.1. Porters Five Forces
- 4.1.1. Bargaining Power of Suppliers
- 4.1.2. Bargaining Power of Buyers
- 4.1.3. Threat of New Entrants
- 4.1.4. Threat of Substitutes
- 4.1.5. Competitive Rivalry
- 4.2. PESTEL analysis
- 4.3. BCG Analysis
- 4.3.1. Stars (High Growth, High Market Share)
- 4.3.2. Cash Cows (Low Growth, High Market Share)
- 4.3.3. Question Mark (High Growth, Low Market Share)
- 4.3.4. Dogs (Low Growth, Low Market Share)
- 4.4. Ansoff Matrix Analysis
- 4.5. Supply Chain Analysis
- 4.6. Regulatory Landscape
- 4.7. Current Market Potential and Opportunity Assessment (TAM–SAM–SOM Framework)
- 4.8. DMV Analyst Note
- 4.1. Porters Five Forces
- 5. Market Analysis, Insights and Forecast 2021-2033
- 5.1. Market Analysis, Insights and Forecast - by Application
- 5.1.1. Banking, Financial Services and Insurance (BFSI)
- 5.1.2. IT and Telecom
- 5.1.3. Government and Defense
- 5.1.4. Healthcare
- 5.1.5. Energy and Utilities
- 5.1.6. Manufacturing and Retail
- 5.1.7. Others
- 5.2. Market Analysis, Insights and Forecast - by Type
- 5.2.1. 42U and Below
- 5.2.2. 43U to 52U
- 5.2.3. Above 52U
- 5.3. Market Analysis, Insights and Forecast - by Region
- 5.3.1. North America
- 5.3.2. South America
- 5.3.3. Europe
- 5.3.4. Middle East & Africa
- 5.3.5. Asia Pacific
- 5.1. Market Analysis, Insights and Forecast - by Application
- 6. Global Data Centre Cabinets Rack Analysis, Insights and Forecast, 2021-2033
- 6.1. Market Analysis, Insights and Forecast - by Application
- 6.1.1. Banking, Financial Services and Insurance (BFSI)
- 6.1.2. IT and Telecom
- 6.1.3. Government and Defense
- 6.1.4. Healthcare
- 6.1.5. Energy and Utilities
- 6.1.6. Manufacturing and Retail
- 6.1.7. Others
- 6.2. Market Analysis, Insights and Forecast - by Type
- 6.2.1. 42U and Below
- 6.2.2. 43U to 52U
- 6.2.3. Above 52U
- 6.1. Market Analysis, Insights and Forecast - by Application
- 7. North America Data Centre Cabinets Rack Analysis, Insights and Forecast, 2020-2032
- 7.1. Market Analysis, Insights and Forecast - by Application
- 7.1.1. Banking, Financial Services and Insurance (BFSI)
- 7.1.2. IT and Telecom
- 7.1.3. Government and Defense
- 7.1.4. Healthcare
- 7.1.5. Energy and Utilities
- 7.1.6. Manufacturing and Retail
- 7.1.7. Others
- 7.2. Market Analysis, Insights and Forecast - by Type
- 7.2.1. 42U and Below
- 7.2.2. 43U to 52U
- 7.2.3. Above 52U
- 7.1. Market Analysis, Insights and Forecast - by Application
- 8. South America Data Centre Cabinets Rack Analysis, Insights and Forecast, 2020-2032
- 8.1. Market Analysis, Insights and Forecast - by Application
- 8.1.1. Banking, Financial Services and Insurance (BFSI)
- 8.1.2. IT and Telecom
- 8.1.3. Government and Defense
- 8.1.4. Healthcare
- 8.1.5. Energy and Utilities
- 8.1.6. Manufacturing and Retail
- 8.1.7. Others
- 8.2. Market Analysis, Insights and Forecast - by Type
- 8.2.1. 42U and Below
- 8.2.2. 43U to 52U
- 8.2.3. Above 52U
- 8.1. Market Analysis, Insights and Forecast - by Application
- 9. Europe Data Centre Cabinets Rack Analysis, Insights and Forecast, 2020-2032
- 9.1. Market Analysis, Insights and Forecast - by Application
- 9.1.1. Banking, Financial Services and Insurance (BFSI)
- 9.1.2. IT and Telecom
- 9.1.3. Government and Defense
- 9.1.4. Healthcare
- 9.1.5. Energy and Utilities
- 9.1.6. Manufacturing and Retail
- 9.1.7. Others
- 9.2. Market Analysis, Insights and Forecast - by Type
- 9.2.1. 42U and Below
- 9.2.2. 43U to 52U
- 9.2.3. Above 52U
- 9.1. Market Analysis, Insights and Forecast - by Application
- 10. Middle East & Africa Data Centre Cabinets Rack Analysis, Insights and Forecast, 2020-2032
- 10.1. Market Analysis, Insights and Forecast - by Application
- 10.1.1. Banking, Financial Services and Insurance (BFSI)
- 10.1.2. IT and Telecom
- 10.1.3. Government and Defense
- 10.1.4. Healthcare
- 10.1.5. Energy and Utilities
- 10.1.6. Manufacturing and Retail
- 10.1.7. Others
- 10.2. Market Analysis, Insights and Forecast - by Type
- 10.2.1. 42U and Below
- 10.2.2. 43U to 52U
- 10.2.3. Above 52U
- 10.1. Market Analysis, Insights and Forecast - by Application
- 11. Asia Pacific Data Centre Cabinets Rack Analysis, Insights and Forecast, 2020-2032
- 11.1. Market Analysis, Insights and Forecast - by Application
- 11.1.1. Banking, Financial Services and Insurance (BFSI)
- 11.1.2. IT and Telecom
- 11.1.3. Government and Defense
- 11.1.4. Healthcare
- 11.1.5. Energy and Utilities
- 11.1.6. Manufacturing and Retail
- 11.1.7. Others
- 11.2. Market Analysis, Insights and Forecast - by Type
- 11.2.1. 42U and Below
- 11.2.2. 43U to 52U
- 11.2.3. Above 52U
- 11.1. Market Analysis, Insights and Forecast - by Application
- 12. Competitive Analysis
- 12.1. Company Profiles
- 12.1.1 Vertiv Group Corp.
- 12.1.1.1. Company Overview
- 12.1.1.2. Products
- 12.1.1.3. Company Financials
- 12.1.1.4. SWOT Analysis
- 12.1.2 Eaton Corporation
- 12.1.2.1. Company Overview
- 12.1.2.2. Products
- 12.1.2.3. Company Financials
- 12.1.2.4. SWOT Analysis
- 12.1.3 Rittal
- 12.1.3.1. Company Overview
- 12.1.3.2. Products
- 12.1.3.3. Company Financials
- 12.1.3.4. SWOT Analysis
- 12.1.4 Innovation First Global Inc.
- 12.1.4.1. Company Overview
- 12.1.4.2. Products
- 12.1.4.3. Company Financials
- 12.1.4.4. SWOT Analysis
- 12.1.5 Dell Technologies
- 12.1.5.1. Company Overview
- 12.1.5.2. Products
- 12.1.5.3. Company Financials
- 12.1.5.4. SWOT Analysis
- 12.1.6 Schneider Electric
- 12.1.6.1. Company Overview
- 12.1.6.2. Products
- 12.1.6.3. Company Financials
- 12.1.6.4. SWOT Analysis
- 12.1.7 Oracle
- 12.1.7.1. Company Overview
- 12.1.7.2. Products
- 12.1.7.3. Company Financials
- 12.1.7.4. SWOT Analysis
- 12.1.8 Legrand
- 12.1.8.1. Company Overview
- 12.1.8.2. Products
- 12.1.8.3. Company Financials
- 12.1.8.4. SWOT Analysis
- 12.1.9 Sysracks
- 12.1.9.1. Company Overview
- 12.1.9.2. Products
- 12.1.9.3. Company Financials
- 12.1.9.4. SWOT Analysis
- 12.1.10 GOMA ELETTRONICA SpA
- 12.1.10.1. Company Overview
- 12.1.10.2. Products
- 12.1.10.3. Company Financials
- 12.1.10.4. SWOT Analysis
- 12.1.1 Vertiv Group Corp.
- 12.2. Market Entropy
- 12.2.1 Company's Key Areas Served
- 12.2.2 Recent Developments
- 12.3. Company Market Share Analysis 2025
- 12.3.1 Top 5 Companies Market Share Analysis
- 12.3.2 Top 3 Companies Market Share Analysis
- 12.4. List of Potential Customers
- 13. Research Methodology
List of Figures
- Figure 1: Global Data Centre Cabinets Rack Revenue Breakdown (billion, %) by Region 2025 & 2033
- Figure 2: Global Data Centre Cabinets Rack Volume Breakdown (K, %) by Region 2025 & 2033
- Figure 3: North America Data Centre Cabinets Rack Revenue (billion), by Application 2025 & 2033
- Figure 4: North America Data Centre Cabinets Rack Volume (K), by Application 2025 & 2033
- Figure 5: North America Data Centre Cabinets Rack Revenue Share (%), by Application 2025 & 2033
- Figure 6: North America Data Centre Cabinets Rack Volume Share (%), by Application 2025 & 2033
- Figure 7: North America Data Centre Cabinets Rack Revenue (billion), by Type 2025 & 2033
- Figure 8: North America Data Centre Cabinets Rack Volume (K), by Type 2025 & 2033
- Figure 9: North America Data Centre Cabinets Rack Revenue Share (%), by Type 2025 & 2033
- Figure 10: North America Data Centre Cabinets Rack Volume Share (%), by Type 2025 & 2033
- Figure 11: North America Data Centre Cabinets Rack Revenue (billion), by Country 2025 & 2033
- Figure 12: North America Data Centre Cabinets Rack Volume (K), by Country 2025 & 2033
- Figure 13: North America Data Centre Cabinets Rack Revenue Share (%), by Country 2025 & 2033
- Figure 14: North America Data Centre Cabinets Rack Volume Share (%), by Country 2025 & 2033
- Figure 15: South America Data Centre Cabinets Rack Revenue (billion), by Application 2025 & 2033
- Figure 16: South America Data Centre Cabinets Rack Volume (K), by Application 2025 & 2033
- Figure 17: South America Data Centre Cabinets Rack Revenue Share (%), by Application 2025 & 2033
- Figure 18: South America Data Centre Cabinets Rack Volume Share (%), by Application 2025 & 2033
- Figure 19: South America Data Centre Cabinets Rack Revenue (billion), by Type 2025 & 2033
- Figure 20: South America Data Centre Cabinets Rack Volume (K), by Type 2025 & 2033
- Figure 21: South America Data Centre Cabinets Rack Revenue Share (%), by Type 2025 & 2033
- Figure 22: South America Data Centre Cabinets Rack Volume Share (%), by Type 2025 & 2033
- Figure 23: South America Data Centre Cabinets Rack Revenue (billion), by Country 2025 & 2033
- Figure 24: South America Data Centre Cabinets Rack Volume (K), by Country 2025 & 2033
- Figure 25: South America Data Centre Cabinets Rack Revenue Share (%), by Country 2025 & 2033
- Figure 26: South America Data Centre Cabinets Rack Volume Share (%), by Country 2025 & 2033
- Figure 27: Europe Data Centre Cabinets Rack Revenue (billion), by Application 2025 & 2033
- Figure 28: Europe Data Centre Cabinets Rack Volume (K), by Application 2025 & 2033
- Figure 29: Europe Data Centre Cabinets Rack Revenue Share (%), by Application 2025 & 2033
- Figure 30: Europe Data Centre Cabinets Rack Volume Share (%), by Application 2025 & 2033
- Figure 31: Europe Data Centre Cabinets Rack Revenue (billion), by Type 2025 & 2033
- Figure 32: Europe Data Centre Cabinets Rack Volume (K), by Type 2025 & 2033
- Figure 33: Europe Data Centre Cabinets Rack Revenue Share (%), by Type 2025 & 2033
- Figure 34: Europe Data Centre Cabinets Rack Volume Share (%), by Type 2025 & 2033
- Figure 35: Europe Data Centre Cabinets Rack Revenue (billion), by Country 2025 & 2033
- Figure 36: Europe Data Centre Cabinets Rack Volume (K), by Country 2025 & 2033
- Figure 37: Europe Data Centre Cabinets Rack Revenue Share (%), by Country 2025 & 2033
- Figure 38: Europe Data Centre Cabinets Rack Volume Share (%), by Country 2025 & 2033
- Figure 39: Middle East & Africa Data Centre Cabinets Rack Revenue (billion), by Application 2025 & 2033
- Figure 40: Middle East & Africa Data Centre Cabinets Rack Volume (K), by Application 2025 & 2033
- Figure 41: Middle East & Africa Data Centre Cabinets Rack Revenue Share (%), by Application 2025 & 2033
- Figure 42: Middle East & Africa Data Centre Cabinets Rack Volume Share (%), by Application 2025 & 2033
- Figure 43: Middle East & Africa Data Centre Cabinets Rack Revenue (billion), by Type 2025 & 2033
- Figure 44: Middle East & Africa Data Centre Cabinets Rack Volume (K), by Type 2025 & 2033
- Figure 45: Middle East & Africa Data Centre Cabinets Rack Revenue Share (%), by Type 2025 & 2033
- Figure 46: Middle East & Africa Data Centre Cabinets Rack Volume Share (%), by Type 2025 & 2033
- Figure 47: Middle East & Africa Data Centre Cabinets Rack Revenue (billion), by Country 2025 & 2033
- Figure 48: Middle East & Africa Data Centre Cabinets Rack Volume (K), by Country 2025 & 2033
- Figure 49: Middle East & Africa Data Centre Cabinets Rack Revenue Share (%), by Country 2025 & 2033
- Figure 50: Middle East & Africa Data Centre Cabinets Rack Volume Share (%), by Country 2025 & 2033
- Figure 51: Asia Pacific Data Centre Cabinets Rack Revenue (billion), by Application 2025 & 2033
- Figure 52: Asia Pacific Data Centre Cabinets Rack Volume (K), by Application 2025 & 2033
- Figure 53: Asia Pacific Data Centre Cabinets Rack Revenue Share (%), by Application 2025 & 2033
- Figure 54: Asia Pacific Data Centre Cabinets Rack Volume Share (%), by Application 2025 & 2033
- Figure 55: Asia Pacific Data Centre Cabinets Rack Revenue (billion), by Type 2025 & 2033
- Figure 56: Asia Pacific Data Centre Cabinets Rack Volume (K), by Type 2025 & 2033
- Figure 57: Asia Pacific Data Centre Cabinets Rack Revenue Share (%), by Type 2025 & 2033
- Figure 58: Asia Pacific Data Centre Cabinets Rack Volume Share (%), by Type 2025 & 2033
- Figure 59: Asia Pacific Data Centre Cabinets Rack Revenue (billion), by Country 2025 & 2033
- Figure 60: Asia Pacific Data Centre Cabinets Rack Volume (K), by Country 2025 & 2033
- Figure 61: Asia Pacific Data Centre Cabinets Rack Revenue Share (%), by Country 2025 & 2033
- Figure 62: Asia Pacific Data Centre Cabinets Rack Volume Share (%), by Country 2025 & 2033
List of Tables
- Table 1: Global Data Centre Cabinets Rack Revenue billion Forecast, by Application 2020 & 2033
- Table 2: Global Data Centre Cabinets Rack Volume K Forecast, by Application 2020 & 2033
- Table 3: Global Data Centre Cabinets Rack Revenue billion Forecast, by Type 2020 & 2033
- Table 4: Global Data Centre Cabinets Rack Volume K Forecast, by Type 2020 & 2033
- Table 5: Global Data Centre Cabinets Rack Revenue billion Forecast, by Region 2020 & 2033
- Table 6: Global Data Centre Cabinets Rack Volume K Forecast, by Region 2020 & 2033
- Table 7: Global Data Centre Cabinets Rack Revenue billion Forecast, by Application 2020 & 2033
- Table 8: Global Data Centre Cabinets Rack Volume K Forecast, by Application 2020 & 2033
- Table 9: Global Data Centre Cabinets Rack Revenue billion Forecast, by Type 2020 & 2033
- Table 10: Global Data Centre Cabinets Rack Volume K Forecast, by Type 2020 & 2033
- Table 11: Global Data Centre Cabinets Rack Revenue billion Forecast, by Country 2020 & 2033
- Table 12: Global Data Centre Cabinets Rack Volume K Forecast, by Country 2020 & 2033
- Table 13: United States Data Centre Cabinets Rack Revenue (billion) Forecast, by Application 2020 & 2033
- Table 14: United States Data Centre Cabinets Rack Volume (K) Forecast, by Application 2020 & 2033
- Table 15: Canada Data Centre Cabinets Rack Revenue (billion) Forecast, by Application 2020 & 2033
- Table 16: Canada Data Centre Cabinets Rack Volume (K) Forecast, by Application 2020 & 2033
- Table 17: Mexico Data Centre Cabinets Rack Revenue (billion) Forecast, by Application 2020 & 2033
- Table 18: Mexico Data Centre Cabinets Rack Volume (K) Forecast, by Application 2020 & 2033
- Table 19: Global Data Centre Cabinets Rack Revenue billion Forecast, by Application 2020 & 2033
- Table 20: Global Data Centre Cabinets Rack Volume K Forecast, by Application 2020 & 2033
- Table 21: Global Data Centre Cabinets Rack Revenue billion Forecast, by Type 2020 & 2033
- Table 22: Global Data Centre Cabinets Rack Volume K Forecast, by Type 2020 & 2033
- Table 23: Global Data Centre Cabinets Rack Revenue billion Forecast, by Country 2020 & 2033
- Table 24: Global Data Centre Cabinets Rack Volume K Forecast, by Country 2020 & 2033
- Table 25: Brazil Data Centre Cabinets Rack Revenue (billion) Forecast, by Application 2020 & 2033
- Table 26: Brazil Data Centre Cabinets Rack Volume (K) Forecast, by Application 2020 & 2033
- Table 27: Argentina Data Centre Cabinets Rack Revenue (billion) Forecast, by Application 2020 & 2033
- Table 28: Argentina Data Centre Cabinets Rack Volume (K) Forecast, by Application 2020 & 2033
- Table 29: Rest of South America Data Centre Cabinets Rack Revenue (billion) Forecast, by Application 2020 & 2033
- Table 30: Rest of South America Data Centre Cabinets Rack Volume (K) Forecast, by Application 2020 & 2033
- Table 31: Global Data Centre Cabinets Rack Revenue billion Forecast, by Application 2020 & 2033
- Table 32: Global Data Centre Cabinets Rack Volume K Forecast, by Application 2020 & 2033
- Table 33: Global Data Centre Cabinets Rack Revenue billion Forecast, by Type 2020 & 2033
- Table 34: Global Data Centre Cabinets Rack Volume K Forecast, by Type 2020 & 2033
- Table 35: Global Data Centre Cabinets Rack Revenue billion Forecast, by Country 2020 & 2033
- Table 36: Global Data Centre Cabinets Rack Volume K Forecast, by Country 2020 & 2033
- Table 37: United Kingdom Data Centre Cabinets Rack Revenue (billion) Forecast, by Application 2020 & 2033
- Table 38: United Kingdom Data Centre Cabinets Rack Volume (K) Forecast, by Application 2020 & 2033
- Table 39: Germany Data Centre Cabinets Rack Revenue (billion) Forecast, by Application 2020 & 2033
- Table 40: Germany Data Centre Cabinets Rack Volume (K) Forecast, by Application 2020 & 2033
- Table 41: France Data Centre Cabinets Rack Revenue (billion) Forecast, by Application 2020 & 2033
- Table 42: France Data Centre Cabinets Rack Volume (K) Forecast, by Application 2020 & 2033
- Table 43: Italy Data Centre Cabinets Rack Revenue (billion) Forecast, by Application 2020 & 2033
- Table 44: Italy Data Centre Cabinets Rack Volume (K) Forecast, by Application 2020 & 2033
- Table 45: Spain Data Centre Cabinets Rack Revenue (billion) Forecast, by Application 2020 & 2033
- Table 46: Spain Data Centre Cabinets Rack Volume (K) Forecast, by Application 2020 & 2033
- Table 47: Russia Data Centre Cabinets Rack Revenue (billion) Forecast, by Application 2020 & 2033
- Table 48: Russia Data Centre Cabinets Rack Volume (K) Forecast, by Application 2020 & 2033
- Table 49: Benelux Data Centre Cabinets Rack Revenue (billion) Forecast, by Application 2020 & 2033
- Table 50: Benelux Data Centre Cabinets Rack Volume (K) Forecast, by Application 2020 & 2033
- Table 51: Nordics Data Centre Cabinets Rack Revenue (billion) Forecast, by Application 2020 & 2033
- Table 52: Nordics Data Centre Cabinets Rack Volume (K) Forecast, by Application 2020 & 2033
- Table 53: Rest of Europe Data Centre Cabinets Rack Revenue (billion) Forecast, by Application 2020 & 2033
- Table 54: Rest of Europe Data Centre Cabinets Rack Volume (K) Forecast, by Application 2020 & 2033
- Table 55: Global Data Centre Cabinets Rack Revenue billion Forecast, by Application 2020 & 2033
- Table 56: Global Data Centre Cabinets Rack Volume K Forecast, by Application 2020 & 2033
- Table 57: Global Data Centre Cabinets Rack Revenue billion Forecast, by Type 2020 & 2033
- Table 58: Global Data Centre Cabinets Rack Volume K Forecast, by Type 2020 & 2033
- Table 59: Global Data Centre Cabinets Rack Revenue billion Forecast, by Country 2020 & 2033
- Table 60: Global Data Centre Cabinets Rack Volume K Forecast, by Country 2020 & 2033
- Table 61: Turkey Data Centre Cabinets Rack Revenue (billion) Forecast, by Application 2020 & 2033
- Table 62: Turkey Data Centre Cabinets Rack Volume (K) Forecast, by Application 2020 & 2033
- Table 63: Israel Data Centre Cabinets Rack Revenue (billion) Forecast, by Application 2020 & 2033
- Table 64: Israel Data Centre Cabinets Rack Volume (K) Forecast, by Application 2020 & 2033
- Table 65: GCC Data Centre Cabinets Rack Revenue (billion) Forecast, by Application 2020 & 2033
- Table 66: GCC Data Centre Cabinets Rack Volume (K) Forecast, by Application 2020 & 2033
- Table 67: North Africa Data Centre Cabinets Rack Revenue (billion) Forecast, by Application 2020 & 2033
- Table 68: North Africa Data Centre Cabinets Rack Volume (K) Forecast, by Application 2020 & 2033
- Table 69: South Africa Data Centre Cabinets Rack Revenue (billion) Forecast, by Application 2020 & 2033
- Table 70: South Africa Data Centre Cabinets Rack Volume (K) Forecast, by Application 2020 & 2033
- Table 71: Rest of Middle East & Africa Data Centre Cabinets Rack Revenue (billion) Forecast, by Application 2020 & 2033
- Table 72: Rest of Middle East & Africa Data Centre Cabinets Rack Volume (K) Forecast, by Application 2020 & 2033
- Table 73: Global Data Centre Cabinets Rack Revenue billion Forecast, by Application 2020 & 2033
- Table 74: Global Data Centre Cabinets Rack Volume K Forecast, by Application 2020 & 2033
- Table 75: Global Data Centre Cabinets Rack Revenue billion Forecast, by Type 2020 & 2033
- Table 76: Global Data Centre Cabinets Rack Volume K Forecast, by Type 2020 & 2033
- Table 77: Global Data Centre Cabinets Rack Revenue billion Forecast, by Country 2020 & 2033
- Table 78: Global Data Centre Cabinets Rack Volume K Forecast, by Country 2020 & 2033
- Table 79: China Data Centre Cabinets Rack Revenue (billion) Forecast, by Application 2020 & 2033
- Table 80: China Data Centre Cabinets Rack Volume (K) Forecast, by Application 2020 & 2033
- Table 81: India Data Centre Cabinets Rack Revenue (billion) Forecast, by Application 2020 & 2033
- Table 82: India Data Centre Cabinets Rack Volume (K) Forecast, by Application 2020 & 2033
- Table 83: Japan Data Centre Cabinets Rack Revenue (billion) Forecast, by Application 2020 & 2033
- Table 84: Japan Data Centre Cabinets Rack Volume (K) Forecast, by Application 2020 & 2033
- Table 85: South Korea Data Centre Cabinets Rack Revenue (billion) Forecast, by Application 2020 & 2033
- Table 86: South Korea Data Centre Cabinets Rack Volume (K) Forecast, by Application 2020 & 2033
- Table 87: ASEAN Data Centre Cabinets Rack Revenue (billion) Forecast, by Application 2020 & 2033
- Table 88: ASEAN Data Centre Cabinets Rack Volume (K) Forecast, by Application 2020 & 2033
- Table 89: Oceania Data Centre Cabinets Rack Revenue (billion) Forecast, by Application 2020 & 2033
- Table 90: Oceania Data Centre Cabinets Rack Volume (K) Forecast, by Application 2020 & 2033
- Table 91: Rest of Asia Pacific Data Centre Cabinets Rack Revenue (billion) Forecast, by Application 2020 & 2033
- Table 92: Rest of Asia Pacific Data Centre Cabinets Rack Volume (K) Forecast, by Application 2020 & 2033
Frequently Asked Questions
1. What is the projected Compound Annual Growth Rate (CAGR) of the Data Centre Cabinets Rack?
The projected CAGR is approximately 12.7%.
2. Which companies are prominent players in the Data Centre Cabinets Rack?
Key companies in the market include Vertiv Group Corp., Eaton Corporation, Rittal, Innovation First Global, Inc., Dell Technologies, Schneider Electric, Oracle, Legrand, Sysracks, GOMA ELETTRONICA SpA.
3. What are the main segments of the Data Centre Cabinets Rack?
The market segments include Application, Type.
4. Can you provide details about the market size?
The market size is estimated to be USD 5.17 billion as of 2022.
5. What are some drivers contributing to market growth?
N/A
6. What are the notable trends driving market growth?
N/A
7. Are there any restraints impacting market growth?
N/A
8. Can you provide examples of recent developments in the market?
N/A
9. What pricing options are available for accessing the report?
Pricing options include single-user, multi-user, and enterprise licenses priced at USD 3950.00, USD 5925.00, and USD 7900.00 respectively.
10. Is the market size provided in terms of value or volume?
The market size is provided in terms of value, measured in billion and volume, measured in K.
11. Are there any specific market keywords associated with the report?
Yes, the market keyword associated with the report is "Data Centre Cabinets Rack," which aids in identifying and referencing the specific market segment covered.
12. How do I determine which pricing option suits my needs best?
The pricing options vary based on user requirements and access needs. Individual users may opt for single-user licenses, while businesses requiring broader access may choose multi-user or enterprise licenses for cost-effective access to the report.
13. Are there any additional resources or data provided in the Data Centre Cabinets Rack report?
While the report offers comprehensive insights, it's advisable to review the specific contents or supplementary materials provided to ascertain if additional resources or data are available.
14. How can I stay updated on further developments or reports in the Data Centre Cabinets Rack?
To stay informed about further developments, trends, and reports in the Data Centre Cabinets Rack, consider subscribing to industry newsletters, following relevant companies and organizations, or regularly checking reputable industry news sources and publications.
Methodology
Step 1 - Identification of Relevant Samples Size from Population Database


Step 2 - Approaches for Defining Global Market Size (Value, Volume* & Price*)

Note*: In applicable scenarios
Step 3 - Data Sources
Primary Research
- Web Analytics
- Survey Reports
- Research Institute
- Latest Research Reports
- Opinion Leaders
Secondary Research
- Annual Reports
- White Paper
- Latest Press Release
- Industry Association
- Paid Database
- Investor Presentations

Step 4 - Data Triangulation
Involves using different sources of information in order to increase the validity of a study
These sources are likely to be stakeholders in a program - participants, other researchers, program staff, other community members, and so on.
Then we put all data in single framework & apply various statistical tools to find out the dynamic on the market.
During the analysis stage, feedback from the stakeholder groups would be compared to determine areas of agreement as well as areas of divergence