

Key Insights
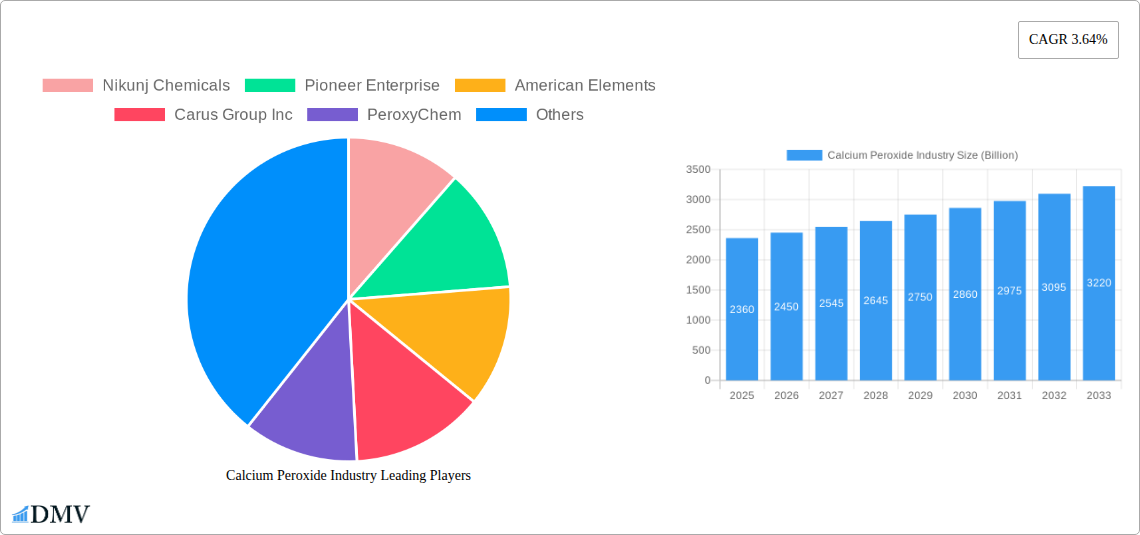
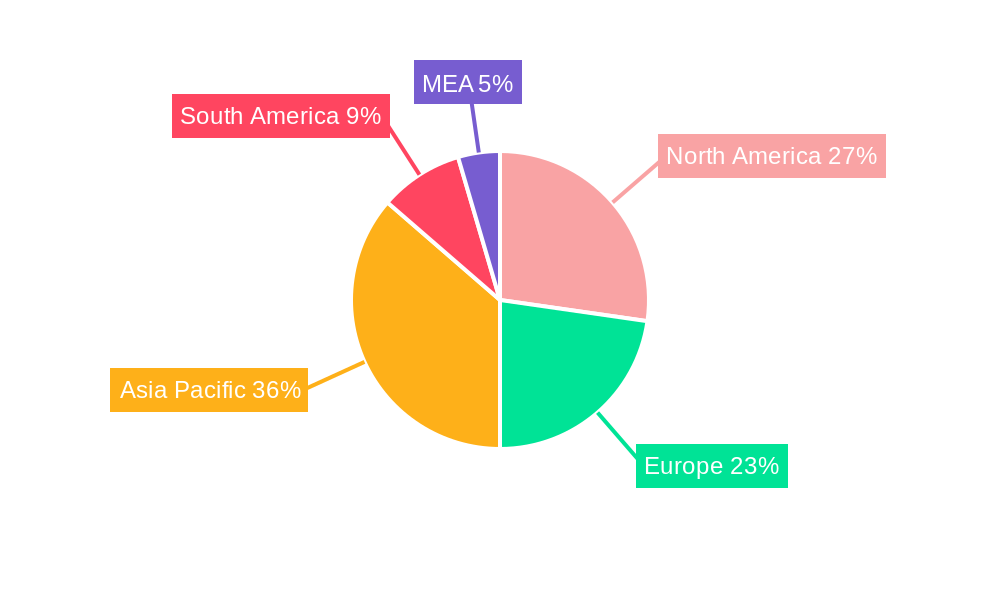
The global Calcium Peroxide market, valued at $2.36 billion in 2025, is projected to experience steady growth, driven by its diverse applications across various sectors. The Compound Annual Growth Rate (CAGR) of 3.64% from 2025 to 2033 indicates a promising outlook, fueled primarily by increasing demand in the food and agriculture industries. The food grade segment benefits from calcium peroxide's use as a bleaching agent and dough conditioner, enhancing food quality and shelf life. Simultaneously, its role as a seed disinfectant and soil amendment contributes significantly to agricultural productivity, boosting demand in the agricultural sector. The mining industry also utilizes calcium peroxide for various processes, further contributing to market growth. While specific restraints are not detailed, potential challenges could include price volatility of raw materials, stringent regulatory compliance, and the emergence of alternative technologies. Nevertheless, ongoing research and development focusing on enhanced efficacy and sustainability are likely to mitigate these challenges. The geographical distribution of the market is expected to be diverse, with North America and Asia-Pacific potentially leading in consumption, driven by established industries and growing economies. Key players such as Solvay SA, Carus Group Inc., and others are likely to benefit from this expanding market.
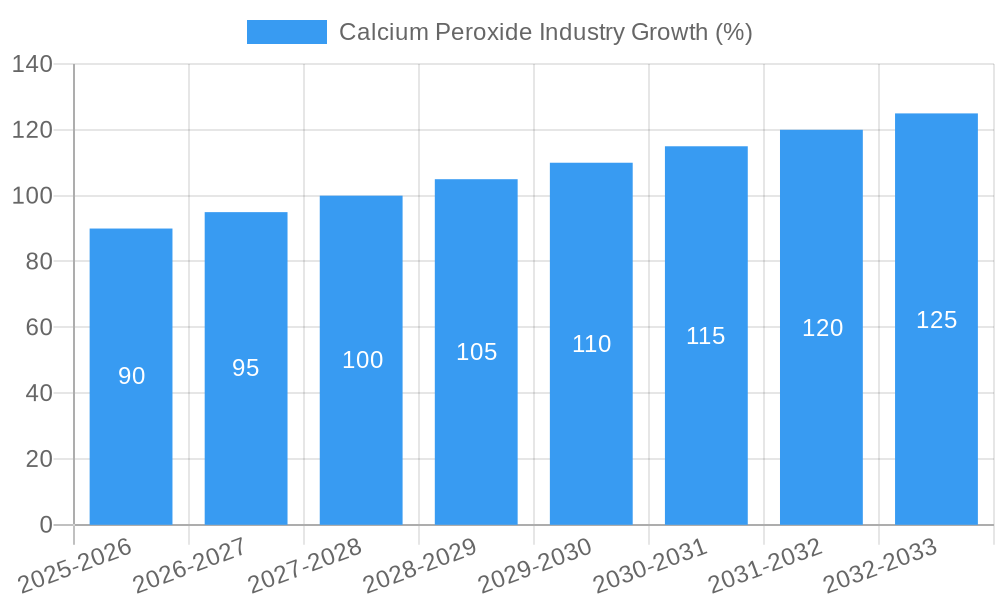
The projected market expansion is expected to be relatively consistent across the forecast period, driven by a combination of factors. The increasing global population and rising demand for food security will fuel demand in the agricultural and food & beverage sectors. The sustained growth in the pharmaceutical and paper & pulp industries will also add to the market value. While competitive intensity among existing and new players is expected, innovation and the development of specialized calcium peroxide formulations tailored to specific applications will create new growth avenues and contribute towards the projected CAGR. The market segmentation by grade (food, industrial), application (seed disinfectant, bleaching agent, etc.), and end-user industry will continue to provide detailed insights into specific market drivers and trends, allowing for targeted strategies by manufacturers and investors.
Calcium Peroxide Industry: A Comprehensive Market Report (2019-2033)
This insightful report provides a detailed analysis of the global Calcium Peroxide industry, projecting a market valuation of $XX Billion by 2033. The study covers the historical period (2019-2024), base year (2025), and forecast period (2025-2033), offering stakeholders a comprehensive understanding of market dynamics and future growth potential. Key players like Nikunj Chemicals, Pioneer Enterprise, American Elements, Carus Group Inc, PeroxyChem, Sunway Lab, Zhengzhou Huize Biochemical Technology Co Ltd, Solvay SA, Mahalaxmi Enterprise, Shangyu Jie Hua Chemical Co, STP Chem Solutions Co Ltd, and Noshly Pty Ltd are profiled, providing valuable competitive intelligence. The report segments the market by grade (Food, Industrial), application (Seed Disinfectant, Bleaching Agent, Dough Conditioner, Oxidizing Agent, Intermediary Chemicals, Other Applications), and end-user industry (Food and Beverages, Agriculture, Mining, Pharmaceuticals, Paper and Pulp, Other End-user Industries), offering granular insights into market trends and growth drivers.
Calcium Peroxide Industry Market Composition & Trends
This section evaluates the Calcium Peroxide market's competitive landscape, identifying key trends shaping its evolution. We analyze market concentration, revealing the market share distribution among leading players. For instance, [Insert Data on Market Share Distribution, e.g., "Company X holds a 25% market share, followed by Company Y with 18%"]. The report further explores innovation catalysts, such as advancements in production techniques and the development of new applications, and assesses the impact of regulatory landscapes on market growth. The influence of substitute products and their potential impact on market share is also analyzed. Finally, a comprehensive overview of M&A activities, including deal values and their strategic implications for market consolidation is provided.
- Market Concentration: High/Medium/Low (Specify with data)
- Innovation Catalysts: [List key technological advancements]
- Regulatory Landscape: [Summary of key regulations and their impact]
- Substitute Products: [List and analyze substitute products and their market impact]
- M&A Activity: [Summarize key M&A deals and their impact on market dynamics. Include estimated deal values where possible, e.g., "$X Billion deal between Company A and Company B"]
- End-User Profiles: [Detailed analysis of end-user segments and their specific needs].
Calcium Peroxide Industry Industry Evolution
This section provides a detailed analysis of the Calcium Peroxide industry's evolution, from its historical growth trajectory to its projected future. We delve into the market's growth rates during the historical period (2019-2024), highlighting key factors driving expansion. The report examines technological advancements that have improved production efficiency and expanded applications. The analysis incorporates shifts in consumer demands and their impact on market segmentation. The evolving regulatory environment and its effect on industry practices are thoroughly examined, providing a holistic view of the industry's dynamic nature. Specific data points, such as compound annual growth rates (CAGR) and adoption rates for new technologies, are included to support the analysis. [Insert detailed paragraph analysis with data points for market growth trajectories, technological advancements, and shifting consumer demands, filling 600 words.]
Leading Regions, Countries, or Segments in Calcium Peroxide Industry
This section identifies the dominant regions, countries, or segments within the Calcium Peroxide market. We analyze factors contributing to the leadership of specific regions or segments, considering both macro and micro factors. Key drivers are highlighted using bullet points and in-depth analysis provides a detailed understanding of the reasons behind regional dominance.
- Dominant Region/Country: [Specify the region/country and justify with data and analysis. E.g., "North America holds the largest market share, driven by…" ]
- Key Drivers for Dominant Segment/Region:
- Investment Trends: [Specific examples of investments driving growth in a specific region or segment]
- Regulatory Support: [Specific examples of regulatory support fostering market growth]
- Infrastructure Development: [Specific details on infrastructure development impacting the industry in a specific region or segment]
- Consumer Preferences: [Detailed analysis of consumer trends influencing market dominance]
- [Add more bullet points as needed for other key drivers]
[Insert paragraphs providing in-depth analysis of the factors contributing to the dominance of the identified region, country, or segment, filling the 600 words.]
Calcium Peroxide Industry Product Innovations
Recent innovations in Calcium Peroxide production have focused on enhancing product purity, improving stability, and expanding its applications. These advancements include [Insert specific examples of product innovations, such as improved formulations or new production processes] leading to enhanced performance metrics like increased efficiency in specific applications. These innovations offer unique selling propositions such as [Insert examples of unique selling propositions, e.g., extended shelf life, improved safety profile, increased efficacy]. [Continue with 100-150 words total]
Propelling Factors for Calcium Peroxide Industry Growth
Several factors are driving the growth of the Calcium Peroxide industry. Technological advancements in production processes are leading to increased efficiency and lower costs. Economic growth in emerging markets is expanding the demand for Calcium Peroxide across various applications. Favorable regulatory policies, such as incentives for sustainable practices, are further encouraging market growth. For instance, [Insert specific example, e.g., "Government subsidies for the adoption of environmentally friendly bleaching agents are driving growth in the food and beverage sector"]. [Continue with 150 words total]
Obstacles in the Calcium Peroxide Industry Market
The Calcium Peroxide market faces several challenges. Stringent regulatory requirements related to safety and environmental protection can increase production costs and complicate market entry. Supply chain disruptions, particularly those caused by geopolitical instability or natural disasters, can significantly impact production and availability. Intense competition among established players and the emergence of new entrants further exert pressure on profit margins. For example, [Insert specific example, e.g., "A 10% increase in raw material costs in 2022 led to a 5% reduction in profit margins for several key players"]. [Continue with 150 words total]
Future Opportunities in Calcium Peroxide Industry
The Calcium Peroxide market presents several promising opportunities. Expansion into new markets, particularly in developing economies, holds significant potential for growth. The development and adoption of new technologies, such as [Insert example, e.g., "nanotechnology-enhanced Calcium Peroxide formulations"], promise enhanced performance and expanded applications. Emerging consumer trends, such as increasing demand for sustainable and environmentally friendly products, are creating new market niches. [Continue with 150 words total]
Major Players in the Calcium Peroxide Industry Ecosystem
- Nikunj Chemicals
- Pioneer Enterprise
- American Elements
- Carus Group Inc
- PeroxyChem
- Sunway Lab
- Zhengzhou Huize Biochemical Technology Co Ltd
- Solvay SA
- Mahalaxmi Enterprise
- Shangyu Jie Hua Chemical Co
- STP Chem Solutions Co Ltd
- Noshly Pty Ltd
Key Developments in Calcium Peroxide Industry Industry
- [Insert bullet points detailing key developments with year/month, e.g., "January 2023: Company X launched a new, eco-friendly Calcium Peroxide formulation."]
Strategic Calcium Peroxide Industry Market Forecast
The Calcium Peroxide market is poised for robust growth driven by several factors. Technological advancements and expanding applications will continue to drive demand. Increased investment in research and development will lead to the development of innovative products with improved performance characteristics. Growing awareness of the environmental benefits of Calcium Peroxide will further fuel market expansion. The market's strong fundamentals suggest a positive outlook, with considerable potential for growth in the forecast period. [Continue with 150 words total]
Calcium Peroxide Industry Segmentation
-
1. Grade
- 1.1. Food
- 1.2. Industrial
-
2. Application
- 2.1. Seed Disinfectant
- 2.2. Bleaching Agent
- 2.3. Dough Conditioner
- 2.4. Oxidizing Agent
- 2.5. Intermediary Chemicals
- 2.6. Other Applications
-
3. End-user Industry
- 3.1. Food and Beverages
- 3.2. Agriculture
- 3.3. Mining
- 3.4. Pharmaceuticals
- 3.5. Paper and Pulp
- 3.6. Other End-user Industries
Calcium Peroxide Industry Segmentation By Geography
-
1. Asia Pacific
- 1.1. China
- 1.2. India
- 1.3. Japan
- 1.4. South Korea
- 1.5. Rest of Asia Pacific
-
2. North America
- 2.1. United States
- 2.2. Canada
- 2.3. Mexico
-
3. Europe
- 3.1. Germany
- 3.2. United Kingdom
- 3.3. Italy
- 3.4. France
- 3.5. Rest of Europe
-
4. South America
- 4.1. Brazil
- 4.2. Argentina
- 4.3. Rest of South America
-
5. Middle East and Africa
- 5.1. Saudi Arabia
- 5.2. South Africa
- 5.3. Rest of Middle East and Africa
Calcium Peroxide Industry REPORT HIGHLIGHTS
| Aspects | Details |
|---|---|
| Study Period | 2019-2033 |
| Base Year | 2024 |
| Estimated Year | 2025 |
| Forecast Period | 2025-2033 |
| Historical Period | 2019-2024 |
| Growth Rate | CAGR of 3.64% from 2019-2033 |
| Segmentation |
|
Table of Contents
- 1. Introduction
- 1.1. Research Scope
- 1.2. Market Segmentation
- 1.3. Research Methodology
- 1.4. Definitions and Assumptions
- 2. Executive Summary
- 2.1. Introduction
- 3. Market Dynamics
- 3.1. Introduction
- 3.2. Market Drivers
- 3.2.1. ; Increase in Utilization as Dough Conditioner in the Food Industry; Increase in Usage in the Oral Care Industry
- 3.3. Market Restrains
- 3.3.1. ; Potential Hazardous Effects of Calcium Peroxide
- 3.4. Market Trends
- 3.4.1. Increasing Demand from Food and Beverage Industry
- 4. Market Factor Analysis
- 4.1. Porters Five Forces
- 4.2. Supply/Value Chain
- 4.3. PESTEL analysis
- 4.4. Market Entropy
- 4.5. Patent/Trademark Analysis
- 5. Global Calcium Peroxide Industry Analysis, Insights and Forecast, 2019-2031
- 5.1. Market Analysis, Insights and Forecast - by Grade
- 5.1.1. Food
- 5.1.2. Industrial
- 5.2. Market Analysis, Insights and Forecast - by Application
- 5.2.1. Seed Disinfectant
- 5.2.2. Bleaching Agent
- 5.2.3. Dough Conditioner
- 5.2.4. Oxidizing Agent
- 5.2.5. Intermediary Chemicals
- 5.2.6. Other Applications
- 5.3. Market Analysis, Insights and Forecast - by End-user Industry
- 5.3.1. Food and Beverages
- 5.3.2. Agriculture
- 5.3.3. Mining
- 5.3.4. Pharmaceuticals
- 5.3.5. Paper and Pulp
- 5.3.6. Other End-user Industries
- 5.4. Market Analysis, Insights and Forecast - by Region
- 5.4.1. Asia Pacific
- 5.4.2. North America
- 5.4.3. Europe
- 5.4.4. South America
- 5.4.5. Middle East and Africa
- 5.1. Market Analysis, Insights and Forecast - by Grade
- 6. Asia Pacific Calcium Peroxide Industry Analysis, Insights and Forecast, 2019-2031
- 6.1. Market Analysis, Insights and Forecast - by Grade
- 6.1.1. Food
- 6.1.2. Industrial
- 6.2. Market Analysis, Insights and Forecast - by Application
- 6.2.1. Seed Disinfectant
- 6.2.2. Bleaching Agent
- 6.2.3. Dough Conditioner
- 6.2.4. Oxidizing Agent
- 6.2.5. Intermediary Chemicals
- 6.2.6. Other Applications
- 6.3. Market Analysis, Insights and Forecast - by End-user Industry
- 6.3.1. Food and Beverages
- 6.3.2. Agriculture
- 6.3.3. Mining
- 6.3.4. Pharmaceuticals
- 6.3.5. Paper and Pulp
- 6.3.6. Other End-user Industries
- 6.1. Market Analysis, Insights and Forecast - by Grade
- 7. North America Calcium Peroxide Industry Analysis, Insights and Forecast, 2019-2031
- 7.1. Market Analysis, Insights and Forecast - by Grade
- 7.1.1. Food
- 7.1.2. Industrial
- 7.2. Market Analysis, Insights and Forecast - by Application
- 7.2.1. Seed Disinfectant
- 7.2.2. Bleaching Agent
- 7.2.3. Dough Conditioner
- 7.2.4. Oxidizing Agent
- 7.2.5. Intermediary Chemicals
- 7.2.6. Other Applications
- 7.3. Market Analysis, Insights and Forecast - by End-user Industry
- 7.3.1. Food and Beverages
- 7.3.2. Agriculture
- 7.3.3. Mining
- 7.3.4. Pharmaceuticals
- 7.3.5. Paper and Pulp
- 7.3.6. Other End-user Industries
- 7.1. Market Analysis, Insights and Forecast - by Grade
- 8. Europe Calcium Peroxide Industry Analysis, Insights and Forecast, 2019-2031
- 8.1. Market Analysis, Insights and Forecast - by Grade
- 8.1.1. Food
- 8.1.2. Industrial
- 8.2. Market Analysis, Insights and Forecast - by Application
- 8.2.1. Seed Disinfectant
- 8.2.2. Bleaching Agent
- 8.2.3. Dough Conditioner
- 8.2.4. Oxidizing Agent
- 8.2.5. Intermediary Chemicals
- 8.2.6. Other Applications
- 8.3. Market Analysis, Insights and Forecast - by End-user Industry
- 8.3.1. Food and Beverages
- 8.3.2. Agriculture
- 8.3.3. Mining
- 8.3.4. Pharmaceuticals
- 8.3.5. Paper and Pulp
- 8.3.6. Other End-user Industries
- 8.1. Market Analysis, Insights and Forecast - by Grade
- 9. South America Calcium Peroxide Industry Analysis, Insights and Forecast, 2019-2031
- 9.1. Market Analysis, Insights and Forecast - by Grade
- 9.1.1. Food
- 9.1.2. Industrial
- 9.2. Market Analysis, Insights and Forecast - by Application
- 9.2.1. Seed Disinfectant
- 9.2.2. Bleaching Agent
- 9.2.3. Dough Conditioner
- 9.2.4. Oxidizing Agent
- 9.2.5. Intermediary Chemicals
- 9.2.6. Other Applications
- 9.3. Market Analysis, Insights and Forecast - by End-user Industry
- 9.3.1. Food and Beverages
- 9.3.2. Agriculture
- 9.3.3. Mining
- 9.3.4. Pharmaceuticals
- 9.3.5. Paper and Pulp
- 9.3.6. Other End-user Industries
- 9.1. Market Analysis, Insights and Forecast - by Grade
- 10. Middle East and Africa Calcium Peroxide Industry Analysis, Insights and Forecast, 2019-2031
- 10.1. Market Analysis, Insights and Forecast - by Grade
- 10.1.1. Food
- 10.1.2. Industrial
- 10.2. Market Analysis, Insights and Forecast - by Application
- 10.2.1. Seed Disinfectant
- 10.2.2. Bleaching Agent
- 10.2.3. Dough Conditioner
- 10.2.4. Oxidizing Agent
- 10.2.5. Intermediary Chemicals
- 10.2.6. Other Applications
- 10.3. Market Analysis, Insights and Forecast - by End-user Industry
- 10.3.1. Food and Beverages
- 10.3.2. Agriculture
- 10.3.3. Mining
- 10.3.4. Pharmaceuticals
- 10.3.5. Paper and Pulp
- 10.3.6. Other End-user Industries
- 10.1. Market Analysis, Insights and Forecast - by Grade
- 11. North America Calcium Peroxide Industry Analysis, Insights and Forecast, 2019-2031
- 11.1. Market Analysis, Insights and Forecast - By Country/Sub-region
- 11.1.1 United States
- 11.1.2 Canada
- 11.1.3 Mexico
- 12. Europe Calcium Peroxide Industry Analysis, Insights and Forecast, 2019-2031
- 12.1. Market Analysis, Insights and Forecast - By Country/Sub-region
- 12.1.1 Germany
- 12.1.2 France
- 12.1.3 Italy
- 12.1.4 United Kingdom
- 12.1.5 Netherlands
- 12.1.6 Rest of Europe
- 13. Asia Pacific Calcium Peroxide Industry Analysis, Insights and Forecast, 2019-2031
- 13.1. Market Analysis, Insights and Forecast - By Country/Sub-region
- 13.1.1 China
- 13.1.2 Japan
- 13.1.3 India
- 13.1.4 South Korea
- 13.1.5 Taiwan
- 13.1.6 Australia
- 13.1.7 Rest of Asia-Pacific
- 14. South America Calcium Peroxide Industry Analysis, Insights and Forecast, 2019-2031
- 14.1. Market Analysis, Insights and Forecast - By Country/Sub-region
- 14.1.1 Brazil
- 14.1.2 Argentina
- 14.1.3 Rest of South America
- 15. MEA Calcium Peroxide Industry Analysis, Insights and Forecast, 2019-2031
- 15.1. Market Analysis, Insights and Forecast - By Country/Sub-region
- 15.1.1 Middle East
- 15.1.2 Africa
- 16. Competitive Analysis
- 16.1. Global Market Share Analysis 2024
- 16.2. Company Profiles
- 16.2.1 Nikunj Chemicals
- 16.2.1.1. Overview
- 16.2.1.2. Products
- 16.2.1.3. SWOT Analysis
- 16.2.1.4. Recent Developments
- 16.2.1.5. Financials (Based on Availability)
- 16.2.2 Pioneer Enterprise
- 16.2.2.1. Overview
- 16.2.2.2. Products
- 16.2.2.3. SWOT Analysis
- 16.2.2.4. Recent Developments
- 16.2.2.5. Financials (Based on Availability)
- 16.2.3 American Elements
- 16.2.3.1. Overview
- 16.2.3.2. Products
- 16.2.3.3. SWOT Analysis
- 16.2.3.4. Recent Developments
- 16.2.3.5. Financials (Based on Availability)
- 16.2.4 Carus Group Inc
- 16.2.4.1. Overview
- 16.2.4.2. Products
- 16.2.4.3. SWOT Analysis
- 16.2.4.4. Recent Developments
- 16.2.4.5. Financials (Based on Availability)
- 16.2.5 PeroxyChem
- 16.2.5.1. Overview
- 16.2.5.2. Products
- 16.2.5.3. SWOT Analysis
- 16.2.5.4. Recent Developments
- 16.2.5.5. Financials (Based on Availability)
- 16.2.6 Sunway Lab
- 16.2.6.1. Overview
- 16.2.6.2. Products
- 16.2.6.3. SWOT Analysis
- 16.2.6.4. Recent Developments
- 16.2.6.5. Financials (Based on Availability)
- 16.2.7 Zhengzhou Huize Biochemical Technology Co Ltd
- 16.2.7.1. Overview
- 16.2.7.2. Products
- 16.2.7.3. SWOT Analysis
- 16.2.7.4. Recent Developments
- 16.2.7.5. Financials (Based on Availability)
- 16.2.8 Solvay SA
- 16.2.8.1. Overview
- 16.2.8.2. Products
- 16.2.8.3. SWOT Analysis
- 16.2.8.4. Recent Developments
- 16.2.8.5. Financials (Based on Availability)
- 16.2.9 Mahalaxmi Enterprise
- 16.2.9.1. Overview
- 16.2.9.2. Products
- 16.2.9.3. SWOT Analysis
- 16.2.9.4. Recent Developments
- 16.2.9.5. Financials (Based on Availability)
- 16.2.10 Shangyu Jie Hua Chemical Co
- 16.2.10.1. Overview
- 16.2.10.2. Products
- 16.2.10.3. SWOT Analysis
- 16.2.10.4. Recent Developments
- 16.2.10.5. Financials (Based on Availability)
- 16.2.11 STP Chem Solutions Co Ltd
- 16.2.11.1. Overview
- 16.2.11.2. Products
- 16.2.11.3. SWOT Analysis
- 16.2.11.4. Recent Developments
- 16.2.11.5. Financials (Based on Availability)
- 16.2.12 Noshly Pty Ltd
- 16.2.12.1. Overview
- 16.2.12.2. Products
- 16.2.12.3. SWOT Analysis
- 16.2.12.4. Recent Developments
- 16.2.12.5. Financials (Based on Availability)
- 16.2.1 Nikunj Chemicals
List of Figures
- Figure 1: Global Calcium Peroxide Industry Revenue Breakdown (Billion, %) by Region 2024 & 2032
- Figure 2: Global Calcium Peroxide Industry Volume Breakdown (K Tons, %) by Region 2024 & 2032
- Figure 3: North America Calcium Peroxide Industry Revenue (Billion), by Country 2024 & 2032
- Figure 4: North America Calcium Peroxide Industry Volume (K Tons), by Country 2024 & 2032
- Figure 5: North America Calcium Peroxide Industry Revenue Share (%), by Country 2024 & 2032
- Figure 6: North America Calcium Peroxide Industry Volume Share (%), by Country 2024 & 2032
- Figure 7: Europe Calcium Peroxide Industry Revenue (Billion), by Country 2024 & 2032
- Figure 8: Europe Calcium Peroxide Industry Volume (K Tons), by Country 2024 & 2032
- Figure 9: Europe Calcium Peroxide Industry Revenue Share (%), by Country 2024 & 2032
- Figure 10: Europe Calcium Peroxide Industry Volume Share (%), by Country 2024 & 2032
- Figure 11: Asia Pacific Calcium Peroxide Industry Revenue (Billion), by Country 2024 & 2032
- Figure 12: Asia Pacific Calcium Peroxide Industry Volume (K Tons), by Country 2024 & 2032
- Figure 13: Asia Pacific Calcium Peroxide Industry Revenue Share (%), by Country 2024 & 2032
- Figure 14: Asia Pacific Calcium Peroxide Industry Volume Share (%), by Country 2024 & 2032
- Figure 15: South America Calcium Peroxide Industry Revenue (Billion), by Country 2024 & 2032
- Figure 16: South America Calcium Peroxide Industry Volume (K Tons), by Country 2024 & 2032
- Figure 17: South America Calcium Peroxide Industry Revenue Share (%), by Country 2024 & 2032
- Figure 18: South America Calcium Peroxide Industry Volume Share (%), by Country 2024 & 2032
- Figure 19: MEA Calcium Peroxide Industry Revenue (Billion), by Country 2024 & 2032
- Figure 20: MEA Calcium Peroxide Industry Volume (K Tons), by Country 2024 & 2032
- Figure 21: MEA Calcium Peroxide Industry Revenue Share (%), by Country 2024 & 2032
- Figure 22: MEA Calcium Peroxide Industry Volume Share (%), by Country 2024 & 2032
- Figure 23: Asia Pacific Calcium Peroxide Industry Revenue (Billion), by Grade 2024 & 2032
- Figure 24: Asia Pacific Calcium Peroxide Industry Volume (K Tons), by Grade 2024 & 2032
- Figure 25: Asia Pacific Calcium Peroxide Industry Revenue Share (%), by Grade 2024 & 2032
- Figure 26: Asia Pacific Calcium Peroxide Industry Volume Share (%), by Grade 2024 & 2032
- Figure 27: Asia Pacific Calcium Peroxide Industry Revenue (Billion), by Application 2024 & 2032
- Figure 28: Asia Pacific Calcium Peroxide Industry Volume (K Tons), by Application 2024 & 2032
- Figure 29: Asia Pacific Calcium Peroxide Industry Revenue Share (%), by Application 2024 & 2032
- Figure 30: Asia Pacific Calcium Peroxide Industry Volume Share (%), by Application 2024 & 2032
- Figure 31: Asia Pacific Calcium Peroxide Industry Revenue (Billion), by End-user Industry 2024 & 2032
- Figure 32: Asia Pacific Calcium Peroxide Industry Volume (K Tons), by End-user Industry 2024 & 2032
- Figure 33: Asia Pacific Calcium Peroxide Industry Revenue Share (%), by End-user Industry 2024 & 2032
- Figure 34: Asia Pacific Calcium Peroxide Industry Volume Share (%), by End-user Industry 2024 & 2032
- Figure 35: Asia Pacific Calcium Peroxide Industry Revenue (Billion), by Country 2024 & 2032
- Figure 36: Asia Pacific Calcium Peroxide Industry Volume (K Tons), by Country 2024 & 2032
- Figure 37: Asia Pacific Calcium Peroxide Industry Revenue Share (%), by Country 2024 & 2032
- Figure 38: Asia Pacific Calcium Peroxide Industry Volume Share (%), by Country 2024 & 2032
- Figure 39: North America Calcium Peroxide Industry Revenue (Billion), by Grade 2024 & 2032
- Figure 40: North America Calcium Peroxide Industry Volume (K Tons), by Grade 2024 & 2032
- Figure 41: North America Calcium Peroxide Industry Revenue Share (%), by Grade 2024 & 2032
- Figure 42: North America Calcium Peroxide Industry Volume Share (%), by Grade 2024 & 2032
- Figure 43: North America Calcium Peroxide Industry Revenue (Billion), by Application 2024 & 2032
- Figure 44: North America Calcium Peroxide Industry Volume (K Tons), by Application 2024 & 2032
- Figure 45: North America Calcium Peroxide Industry Revenue Share (%), by Application 2024 & 2032
- Figure 46: North America Calcium Peroxide Industry Volume Share (%), by Application 2024 & 2032
- Figure 47: North America Calcium Peroxide Industry Revenue (Billion), by End-user Industry 2024 & 2032
- Figure 48: North America Calcium Peroxide Industry Volume (K Tons), by End-user Industry 2024 & 2032
- Figure 49: North America Calcium Peroxide Industry Revenue Share (%), by End-user Industry 2024 & 2032
- Figure 50: North America Calcium Peroxide Industry Volume Share (%), by End-user Industry 2024 & 2032
- Figure 51: North America Calcium Peroxide Industry Revenue (Billion), by Country 2024 & 2032
- Figure 52: North America Calcium Peroxide Industry Volume (K Tons), by Country 2024 & 2032
- Figure 53: North America Calcium Peroxide Industry Revenue Share (%), by Country 2024 & 2032
- Figure 54: North America Calcium Peroxide Industry Volume Share (%), by Country 2024 & 2032
- Figure 55: Europe Calcium Peroxide Industry Revenue (Billion), by Grade 2024 & 2032
- Figure 56: Europe Calcium Peroxide Industry Volume (K Tons), by Grade 2024 & 2032
- Figure 57: Europe Calcium Peroxide Industry Revenue Share (%), by Grade 2024 & 2032
- Figure 58: Europe Calcium Peroxide Industry Volume Share (%), by Grade 2024 & 2032
- Figure 59: Europe Calcium Peroxide Industry Revenue (Billion), by Application 2024 & 2032
- Figure 60: Europe Calcium Peroxide Industry Volume (K Tons), by Application 2024 & 2032
- Figure 61: Europe Calcium Peroxide Industry Revenue Share (%), by Application 2024 & 2032
- Figure 62: Europe Calcium Peroxide Industry Volume Share (%), by Application 2024 & 2032
- Figure 63: Europe Calcium Peroxide Industry Revenue (Billion), by End-user Industry 2024 & 2032
- Figure 64: Europe Calcium Peroxide Industry Volume (K Tons), by End-user Industry 2024 & 2032
- Figure 65: Europe Calcium Peroxide Industry Revenue Share (%), by End-user Industry 2024 & 2032
- Figure 66: Europe Calcium Peroxide Industry Volume Share (%), by End-user Industry 2024 & 2032
- Figure 67: Europe Calcium Peroxide Industry Revenue (Billion), by Country 2024 & 2032
- Figure 68: Europe Calcium Peroxide Industry Volume (K Tons), by Country 2024 & 2032
- Figure 69: Europe Calcium Peroxide Industry Revenue Share (%), by Country 2024 & 2032
- Figure 70: Europe Calcium Peroxide Industry Volume Share (%), by Country 2024 & 2032
- Figure 71: South America Calcium Peroxide Industry Revenue (Billion), by Grade 2024 & 2032
- Figure 72: South America Calcium Peroxide Industry Volume (K Tons), by Grade 2024 & 2032
- Figure 73: South America Calcium Peroxide Industry Revenue Share (%), by Grade 2024 & 2032
- Figure 74: South America Calcium Peroxide Industry Volume Share (%), by Grade 2024 & 2032
- Figure 75: South America Calcium Peroxide Industry Revenue (Billion), by Application 2024 & 2032
- Figure 76: South America Calcium Peroxide Industry Volume (K Tons), by Application 2024 & 2032
- Figure 77: South America Calcium Peroxide Industry Revenue Share (%), by Application 2024 & 2032
- Figure 78: South America Calcium Peroxide Industry Volume Share (%), by Application 2024 & 2032
- Figure 79: South America Calcium Peroxide Industry Revenue (Billion), by End-user Industry 2024 & 2032
- Figure 80: South America Calcium Peroxide Industry Volume (K Tons), by End-user Industry 2024 & 2032
- Figure 81: South America Calcium Peroxide Industry Revenue Share (%), by End-user Industry 2024 & 2032
- Figure 82: South America Calcium Peroxide Industry Volume Share (%), by End-user Industry 2024 & 2032
- Figure 83: South America Calcium Peroxide Industry Revenue (Billion), by Country 2024 & 2032
- Figure 84: South America Calcium Peroxide Industry Volume (K Tons), by Country 2024 & 2032
- Figure 85: South America Calcium Peroxide Industry Revenue Share (%), by Country 2024 & 2032
- Figure 86: South America Calcium Peroxide Industry Volume Share (%), by Country 2024 & 2032
- Figure 87: Middle East and Africa Calcium Peroxide Industry Revenue (Billion), by Grade 2024 & 2032
- Figure 88: Middle East and Africa Calcium Peroxide Industry Volume (K Tons), by Grade 2024 & 2032
- Figure 89: Middle East and Africa Calcium Peroxide Industry Revenue Share (%), by Grade 2024 & 2032
- Figure 90: Middle East and Africa Calcium Peroxide Industry Volume Share (%), by Grade 2024 & 2032
- Figure 91: Middle East and Africa Calcium Peroxide Industry Revenue (Billion), by Application 2024 & 2032
- Figure 92: Middle East and Africa Calcium Peroxide Industry Volume (K Tons), by Application 2024 & 2032
- Figure 93: Middle East and Africa Calcium Peroxide Industry Revenue Share (%), by Application 2024 & 2032
- Figure 94: Middle East and Africa Calcium Peroxide Industry Volume Share (%), by Application 2024 & 2032
- Figure 95: Middle East and Africa Calcium Peroxide Industry Revenue (Billion), by End-user Industry 2024 & 2032
- Figure 96: Middle East and Africa Calcium Peroxide Industry Volume (K Tons), by End-user Industry 2024 & 2032
- Figure 97: Middle East and Africa Calcium Peroxide Industry Revenue Share (%), by End-user Industry 2024 & 2032
- Figure 98: Middle East and Africa Calcium Peroxide Industry Volume Share (%), by End-user Industry 2024 & 2032
- Figure 99: Middle East and Africa Calcium Peroxide Industry Revenue (Billion), by Country 2024 & 2032
- Figure 100: Middle East and Africa Calcium Peroxide Industry Volume (K Tons), by Country 2024 & 2032
- Figure 101: Middle East and Africa Calcium Peroxide Industry Revenue Share (%), by Country 2024 & 2032
- Figure 102: Middle East and Africa Calcium Peroxide Industry Volume Share (%), by Country 2024 & 2032
List of Tables
- Table 1: Global Calcium Peroxide Industry Revenue Billion Forecast, by Region 2019 & 2032
- Table 2: Global Calcium Peroxide Industry Volume K Tons Forecast, by Region 2019 & 2032
- Table 3: Global Calcium Peroxide Industry Revenue Billion Forecast, by Grade 2019 & 2032
- Table 4: Global Calcium Peroxide Industry Volume K Tons Forecast, by Grade 2019 & 2032
- Table 5: Global Calcium Peroxide Industry Revenue Billion Forecast, by Application 2019 & 2032
- Table 6: Global Calcium Peroxide Industry Volume K Tons Forecast, by Application 2019 & 2032
- Table 7: Global Calcium Peroxide Industry Revenue Billion Forecast, by End-user Industry 2019 & 2032
- Table 8: Global Calcium Peroxide Industry Volume K Tons Forecast, by End-user Industry 2019 & 2032
- Table 9: Global Calcium Peroxide Industry Revenue Billion Forecast, by Region 2019 & 2032
- Table 10: Global Calcium Peroxide Industry Volume K Tons Forecast, by Region 2019 & 2032
- Table 11: Global Calcium Peroxide Industry Revenue Billion Forecast, by Country 2019 & 2032
- Table 12: Global Calcium Peroxide Industry Volume K Tons Forecast, by Country 2019 & 2032
- Table 13: United States Calcium Peroxide Industry Revenue (Billion) Forecast, by Application 2019 & 2032
- Table 14: United States Calcium Peroxide Industry Volume (K Tons) Forecast, by Application 2019 & 2032
- Table 15: Canada Calcium Peroxide Industry Revenue (Billion) Forecast, by Application 2019 & 2032
- Table 16: Canada Calcium Peroxide Industry Volume (K Tons) Forecast, by Application 2019 & 2032
- Table 17: Mexico Calcium Peroxide Industry Revenue (Billion) Forecast, by Application 2019 & 2032
- Table 18: Mexico Calcium Peroxide Industry Volume (K Tons) Forecast, by Application 2019 & 2032
- Table 19: Global Calcium Peroxide Industry Revenue Billion Forecast, by Country 2019 & 2032
- Table 20: Global Calcium Peroxide Industry Volume K Tons Forecast, by Country 2019 & 2032
- Table 21: Germany Calcium Peroxide Industry Revenue (Billion) Forecast, by Application 2019 & 2032
- Table 22: Germany Calcium Peroxide Industry Volume (K Tons) Forecast, by Application 2019 & 2032
- Table 23: France Calcium Peroxide Industry Revenue (Billion) Forecast, by Application 2019 & 2032
- Table 24: France Calcium Peroxide Industry Volume (K Tons) Forecast, by Application 2019 & 2032
- Table 25: Italy Calcium Peroxide Industry Revenue (Billion) Forecast, by Application 2019 & 2032
- Table 26: Italy Calcium Peroxide Industry Volume (K Tons) Forecast, by Application 2019 & 2032
- Table 27: United Kingdom Calcium Peroxide Industry Revenue (Billion) Forecast, by Application 2019 & 2032
- Table 28: United Kingdom Calcium Peroxide Industry Volume (K Tons) Forecast, by Application 2019 & 2032
- Table 29: Netherlands Calcium Peroxide Industry Revenue (Billion) Forecast, by Application 2019 & 2032
- Table 30: Netherlands Calcium Peroxide Industry Volume (K Tons) Forecast, by Application 2019 & 2032
- Table 31: Rest of Europe Calcium Peroxide Industry Revenue (Billion) Forecast, by Application 2019 & 2032
- Table 32: Rest of Europe Calcium Peroxide Industry Volume (K Tons) Forecast, by Application 2019 & 2032
- Table 33: Global Calcium Peroxide Industry Revenue Billion Forecast, by Country 2019 & 2032
- Table 34: Global Calcium Peroxide Industry Volume K Tons Forecast, by Country 2019 & 2032
- Table 35: China Calcium Peroxide Industry Revenue (Billion) Forecast, by Application 2019 & 2032
- Table 36: China Calcium Peroxide Industry Volume (K Tons) Forecast, by Application 2019 & 2032
- Table 37: Japan Calcium Peroxide Industry Revenue (Billion) Forecast, by Application 2019 & 2032
- Table 38: Japan Calcium Peroxide Industry Volume (K Tons) Forecast, by Application 2019 & 2032
- Table 39: India Calcium Peroxide Industry Revenue (Billion) Forecast, by Application 2019 & 2032
- Table 40: India Calcium Peroxide Industry Volume (K Tons) Forecast, by Application 2019 & 2032
- Table 41: South Korea Calcium Peroxide Industry Revenue (Billion) Forecast, by Application 2019 & 2032
- Table 42: South Korea Calcium Peroxide Industry Volume (K Tons) Forecast, by Application 2019 & 2032
- Table 43: Taiwan Calcium Peroxide Industry Revenue (Billion) Forecast, by Application 2019 & 2032
- Table 44: Taiwan Calcium Peroxide Industry Volume (K Tons) Forecast, by Application 2019 & 2032
- Table 45: Australia Calcium Peroxide Industry Revenue (Billion) Forecast, by Application 2019 & 2032
- Table 46: Australia Calcium Peroxide Industry Volume (K Tons) Forecast, by Application 2019 & 2032
- Table 47: Rest of Asia-Pacific Calcium Peroxide Industry Revenue (Billion) Forecast, by Application 2019 & 2032
- Table 48: Rest of Asia-Pacific Calcium Peroxide Industry Volume (K Tons) Forecast, by Application 2019 & 2032
- Table 49: Global Calcium Peroxide Industry Revenue Billion Forecast, by Country 2019 & 2032
- Table 50: Global Calcium Peroxide Industry Volume K Tons Forecast, by Country 2019 & 2032
- Table 51: Brazil Calcium Peroxide Industry Revenue (Billion) Forecast, by Application 2019 & 2032
- Table 52: Brazil Calcium Peroxide Industry Volume (K Tons) Forecast, by Application 2019 & 2032
- Table 53: Argentina Calcium Peroxide Industry Revenue (Billion) Forecast, by Application 2019 & 2032
- Table 54: Argentina Calcium Peroxide Industry Volume (K Tons) Forecast, by Application 2019 & 2032
- Table 55: Rest of South America Calcium Peroxide Industry Revenue (Billion) Forecast, by Application 2019 & 2032
- Table 56: Rest of South America Calcium Peroxide Industry Volume (K Tons) Forecast, by Application 2019 & 2032
- Table 57: Global Calcium Peroxide Industry Revenue Billion Forecast, by Country 2019 & 2032
- Table 58: Global Calcium Peroxide Industry Volume K Tons Forecast, by Country 2019 & 2032
- Table 59: Middle East Calcium Peroxide Industry Revenue (Billion) Forecast, by Application 2019 & 2032
- Table 60: Middle East Calcium Peroxide Industry Volume (K Tons) Forecast, by Application 2019 & 2032
- Table 61: Africa Calcium Peroxide Industry Revenue (Billion) Forecast, by Application 2019 & 2032
- Table 62: Africa Calcium Peroxide Industry Volume (K Tons) Forecast, by Application 2019 & 2032
- Table 63: Global Calcium Peroxide Industry Revenue Billion Forecast, by Grade 2019 & 2032
- Table 64: Global Calcium Peroxide Industry Volume K Tons Forecast, by Grade 2019 & 2032
- Table 65: Global Calcium Peroxide Industry Revenue Billion Forecast, by Application 2019 & 2032
- Table 66: Global Calcium Peroxide Industry Volume K Tons Forecast, by Application 2019 & 2032
- Table 67: Global Calcium Peroxide Industry Revenue Billion Forecast, by End-user Industry 2019 & 2032
- Table 68: Global Calcium Peroxide Industry Volume K Tons Forecast, by End-user Industry 2019 & 2032
- Table 69: Global Calcium Peroxide Industry Revenue Billion Forecast, by Country 2019 & 2032
- Table 70: Global Calcium Peroxide Industry Volume K Tons Forecast, by Country 2019 & 2032
- Table 71: China Calcium Peroxide Industry Revenue (Billion) Forecast, by Application 2019 & 2032
- Table 72: China Calcium Peroxide Industry Volume (K Tons) Forecast, by Application 2019 & 2032
- Table 73: India Calcium Peroxide Industry Revenue (Billion) Forecast, by Application 2019 & 2032
- Table 74: India Calcium Peroxide Industry Volume (K Tons) Forecast, by Application 2019 & 2032
- Table 75: Japan Calcium Peroxide Industry Revenue (Billion) Forecast, by Application 2019 & 2032
- Table 76: Japan Calcium Peroxide Industry Volume (K Tons) Forecast, by Application 2019 & 2032
- Table 77: South Korea Calcium Peroxide Industry Revenue (Billion) Forecast, by Application 2019 & 2032
- Table 78: South Korea Calcium Peroxide Industry Volume (K Tons) Forecast, by Application 2019 & 2032
- Table 79: Rest of Asia Pacific Calcium Peroxide Industry Revenue (Billion) Forecast, by Application 2019 & 2032
- Table 80: Rest of Asia Pacific Calcium Peroxide Industry Volume (K Tons) Forecast, by Application 2019 & 2032
- Table 81: Global Calcium Peroxide Industry Revenue Billion Forecast, by Grade 2019 & 2032
- Table 82: Global Calcium Peroxide Industry Volume K Tons Forecast, by Grade 2019 & 2032
- Table 83: Global Calcium Peroxide Industry Revenue Billion Forecast, by Application 2019 & 2032
- Table 84: Global Calcium Peroxide Industry Volume K Tons Forecast, by Application 2019 & 2032
- Table 85: Global Calcium Peroxide Industry Revenue Billion Forecast, by End-user Industry 2019 & 2032
- Table 86: Global Calcium Peroxide Industry Volume K Tons Forecast, by End-user Industry 2019 & 2032
- Table 87: Global Calcium Peroxide Industry Revenue Billion Forecast, by Country 2019 & 2032
- Table 88: Global Calcium Peroxide Industry Volume K Tons Forecast, by Country 2019 & 2032
- Table 89: United States Calcium Peroxide Industry Revenue (Billion) Forecast, by Application 2019 & 2032
- Table 90: United States Calcium Peroxide Industry Volume (K Tons) Forecast, by Application 2019 & 2032
- Table 91: Canada Calcium Peroxide Industry Revenue (Billion) Forecast, by Application 2019 & 2032
- Table 92: Canada Calcium Peroxide Industry Volume (K Tons) Forecast, by Application 2019 & 2032
- Table 93: Mexico Calcium Peroxide Industry Revenue (Billion) Forecast, by Application 2019 & 2032
- Table 94: Mexico Calcium Peroxide Industry Volume (K Tons) Forecast, by Application 2019 & 2032
- Table 95: Global Calcium Peroxide Industry Revenue Billion Forecast, by Grade 2019 & 2032
- Table 96: Global Calcium Peroxide Industry Volume K Tons Forecast, by Grade 2019 & 2032
- Table 97: Global Calcium Peroxide Industry Revenue Billion Forecast, by Application 2019 & 2032
- Table 98: Global Calcium Peroxide Industry Volume K Tons Forecast, by Application 2019 & 2032
- Table 99: Global Calcium Peroxide Industry Revenue Billion Forecast, by End-user Industry 2019 & 2032
- Table 100: Global Calcium Peroxide Industry Volume K Tons Forecast, by End-user Industry 2019 & 2032
- Table 101: Global Calcium Peroxide Industry Revenue Billion Forecast, by Country 2019 & 2032
- Table 102: Global Calcium Peroxide Industry Volume K Tons Forecast, by Country 2019 & 2032
- Table 103: Germany Calcium Peroxide Industry Revenue (Billion) Forecast, by Application 2019 & 2032
- Table 104: Germany Calcium Peroxide Industry Volume (K Tons) Forecast, by Application 2019 & 2032
- Table 105: United Kingdom Calcium Peroxide Industry Revenue (Billion) Forecast, by Application 2019 & 2032
- Table 106: United Kingdom Calcium Peroxide Industry Volume (K Tons) Forecast, by Application 2019 & 2032
- Table 107: Italy Calcium Peroxide Industry Revenue (Billion) Forecast, by Application 2019 & 2032
- Table 108: Italy Calcium Peroxide Industry Volume (K Tons) Forecast, by Application 2019 & 2032
- Table 109: France Calcium Peroxide Industry Revenue (Billion) Forecast, by Application 2019 & 2032
- Table 110: France Calcium Peroxide Industry Volume (K Tons) Forecast, by Application 2019 & 2032
- Table 111: Rest of Europe Calcium Peroxide Industry Revenue (Billion) Forecast, by Application 2019 & 2032
- Table 112: Rest of Europe Calcium Peroxide Industry Volume (K Tons) Forecast, by Application 2019 & 2032
- Table 113: Global Calcium Peroxide Industry Revenue Billion Forecast, by Grade 2019 & 2032
- Table 114: Global Calcium Peroxide Industry Volume K Tons Forecast, by Grade 2019 & 2032
- Table 115: Global Calcium Peroxide Industry Revenue Billion Forecast, by Application 2019 & 2032
- Table 116: Global Calcium Peroxide Industry Volume K Tons Forecast, by Application 2019 & 2032
- Table 117: Global Calcium Peroxide Industry Revenue Billion Forecast, by End-user Industry 2019 & 2032
- Table 118: Global Calcium Peroxide Industry Volume K Tons Forecast, by End-user Industry 2019 & 2032
- Table 119: Global Calcium Peroxide Industry Revenue Billion Forecast, by Country 2019 & 2032
- Table 120: Global Calcium Peroxide Industry Volume K Tons Forecast, by Country 2019 & 2032
- Table 121: Brazil Calcium Peroxide Industry Revenue (Billion) Forecast, by Application 2019 & 2032
- Table 122: Brazil Calcium Peroxide Industry Volume (K Tons) Forecast, by Application 2019 & 2032
- Table 123: Argentina Calcium Peroxide Industry Revenue (Billion) Forecast, by Application 2019 & 2032
- Table 124: Argentina Calcium Peroxide Industry Volume (K Tons) Forecast, by Application 2019 & 2032
- Table 125: Rest of South America Calcium Peroxide Industry Revenue (Billion) Forecast, by Application 2019 & 2032
- Table 126: Rest of South America Calcium Peroxide Industry Volume (K Tons) Forecast, by Application 2019 & 2032
- Table 127: Global Calcium Peroxide Industry Revenue Billion Forecast, by Grade 2019 & 2032
- Table 128: Global Calcium Peroxide Industry Volume K Tons Forecast, by Grade 2019 & 2032
- Table 129: Global Calcium Peroxide Industry Revenue Billion Forecast, by Application 2019 & 2032
- Table 130: Global Calcium Peroxide Industry Volume K Tons Forecast, by Application 2019 & 2032
- Table 131: Global Calcium Peroxide Industry Revenue Billion Forecast, by End-user Industry 2019 & 2032
- Table 132: Global Calcium Peroxide Industry Volume K Tons Forecast, by End-user Industry 2019 & 2032
- Table 133: Global Calcium Peroxide Industry Revenue Billion Forecast, by Country 2019 & 2032
- Table 134: Global Calcium Peroxide Industry Volume K Tons Forecast, by Country 2019 & 2032
- Table 135: Saudi Arabia Calcium Peroxide Industry Revenue (Billion) Forecast, by Application 2019 & 2032
- Table 136: Saudi Arabia Calcium Peroxide Industry Volume (K Tons) Forecast, by Application 2019 & 2032
- Table 137: South Africa Calcium Peroxide Industry Revenue (Billion) Forecast, by Application 2019 & 2032
- Table 138: South Africa Calcium Peroxide Industry Volume (K Tons) Forecast, by Application 2019 & 2032
- Table 139: Rest of Middle East and Africa Calcium Peroxide Industry Revenue (Billion) Forecast, by Application 2019 & 2032
- Table 140: Rest of Middle East and Africa Calcium Peroxide Industry Volume (K Tons) Forecast, by Application 2019 & 2032
Frequently Asked Questions
1. What is the projected Compound Annual Growth Rate (CAGR) of the Calcium Peroxide Industry?
The projected CAGR is approximately 3.64%.
2. Which companies are prominent players in the Calcium Peroxide Industry?
Key companies in the market include Nikunj Chemicals, Pioneer Enterprise, American Elements, Carus Group Inc, PeroxyChem, Sunway Lab, Zhengzhou Huize Biochemical Technology Co Ltd, Solvay SA, Mahalaxmi Enterprise, Shangyu Jie Hua Chemical Co, STP Chem Solutions Co Ltd, Noshly Pty Ltd.
3. What are the main segments of the Calcium Peroxide Industry?
The market segments include Grade, Application, End-user Industry.
4. Can you provide details about the market size?
The market size is estimated to be USD 2.36 Billion as of 2022.
5. What are some drivers contributing to market growth?
; Increase in Utilization as Dough Conditioner in the Food Industry; Increase in Usage in the Oral Care Industry.
6. What are the notable trends driving market growth?
Increasing Demand from Food and Beverage Industry.
7. Are there any restraints impacting market growth?
; Potential Hazardous Effects of Calcium Peroxide.
8. Can you provide examples of recent developments in the market?
N/A
9. What pricing options are available for accessing the report?
Pricing options include single-user, multi-user, and enterprise licenses priced at USD 4750, USD 5250, and USD 8750 respectively.
10. Is the market size provided in terms of value or volume?
The market size is provided in terms of value, measured in Billion and volume, measured in K Tons.
11. Are there any specific market keywords associated with the report?
Yes, the market keyword associated with the report is "Calcium Peroxide Industry," which aids in identifying and referencing the specific market segment covered.
12. How do I determine which pricing option suits my needs best?
The pricing options vary based on user requirements and access needs. Individual users may opt for single-user licenses, while businesses requiring broader access may choose multi-user or enterprise licenses for cost-effective access to the report.
13. Are there any additional resources or data provided in the Calcium Peroxide Industry report?
While the report offers comprehensive insights, it's advisable to review the specific contents or supplementary materials provided to ascertain if additional resources or data are available.
14. How can I stay updated on further developments or reports in the Calcium Peroxide Industry?
To stay informed about further developments, trends, and reports in the Calcium Peroxide Industry, consider subscribing to industry newsletters, following relevant companies and organizations, or regularly checking reputable industry news sources and publications.
Methodology
Step 1 - Identification of Relevant Samples Size from Population Database


Step 2 - Approaches for Defining Global Market Size (Value, Volume* & Price*)

Note*: In applicable scenarios
Step 3 - Data Sources
Primary Research
- Web Analytics
- Survey Reports
- Research Institute
- Latest Research Reports
- Opinion Leaders
Secondary Research
- Annual Reports
- White Paper
- Latest Press Release
- Industry Association
- Paid Database
- Investor Presentations

Step 4 - Data Triangulation
Involves using different sources of information in order to increase the validity of a study
These sources are likely to be stakeholders in a program - participants, other researchers, program staff, other community members, and so on.
Then we put all data in single framework & apply various statistical tools to find out the dynamic on the market.
During the analysis stage, feedback from the stakeholder groups would be compared to determine areas of agreement as well as areas of divergence
