

Key Insights
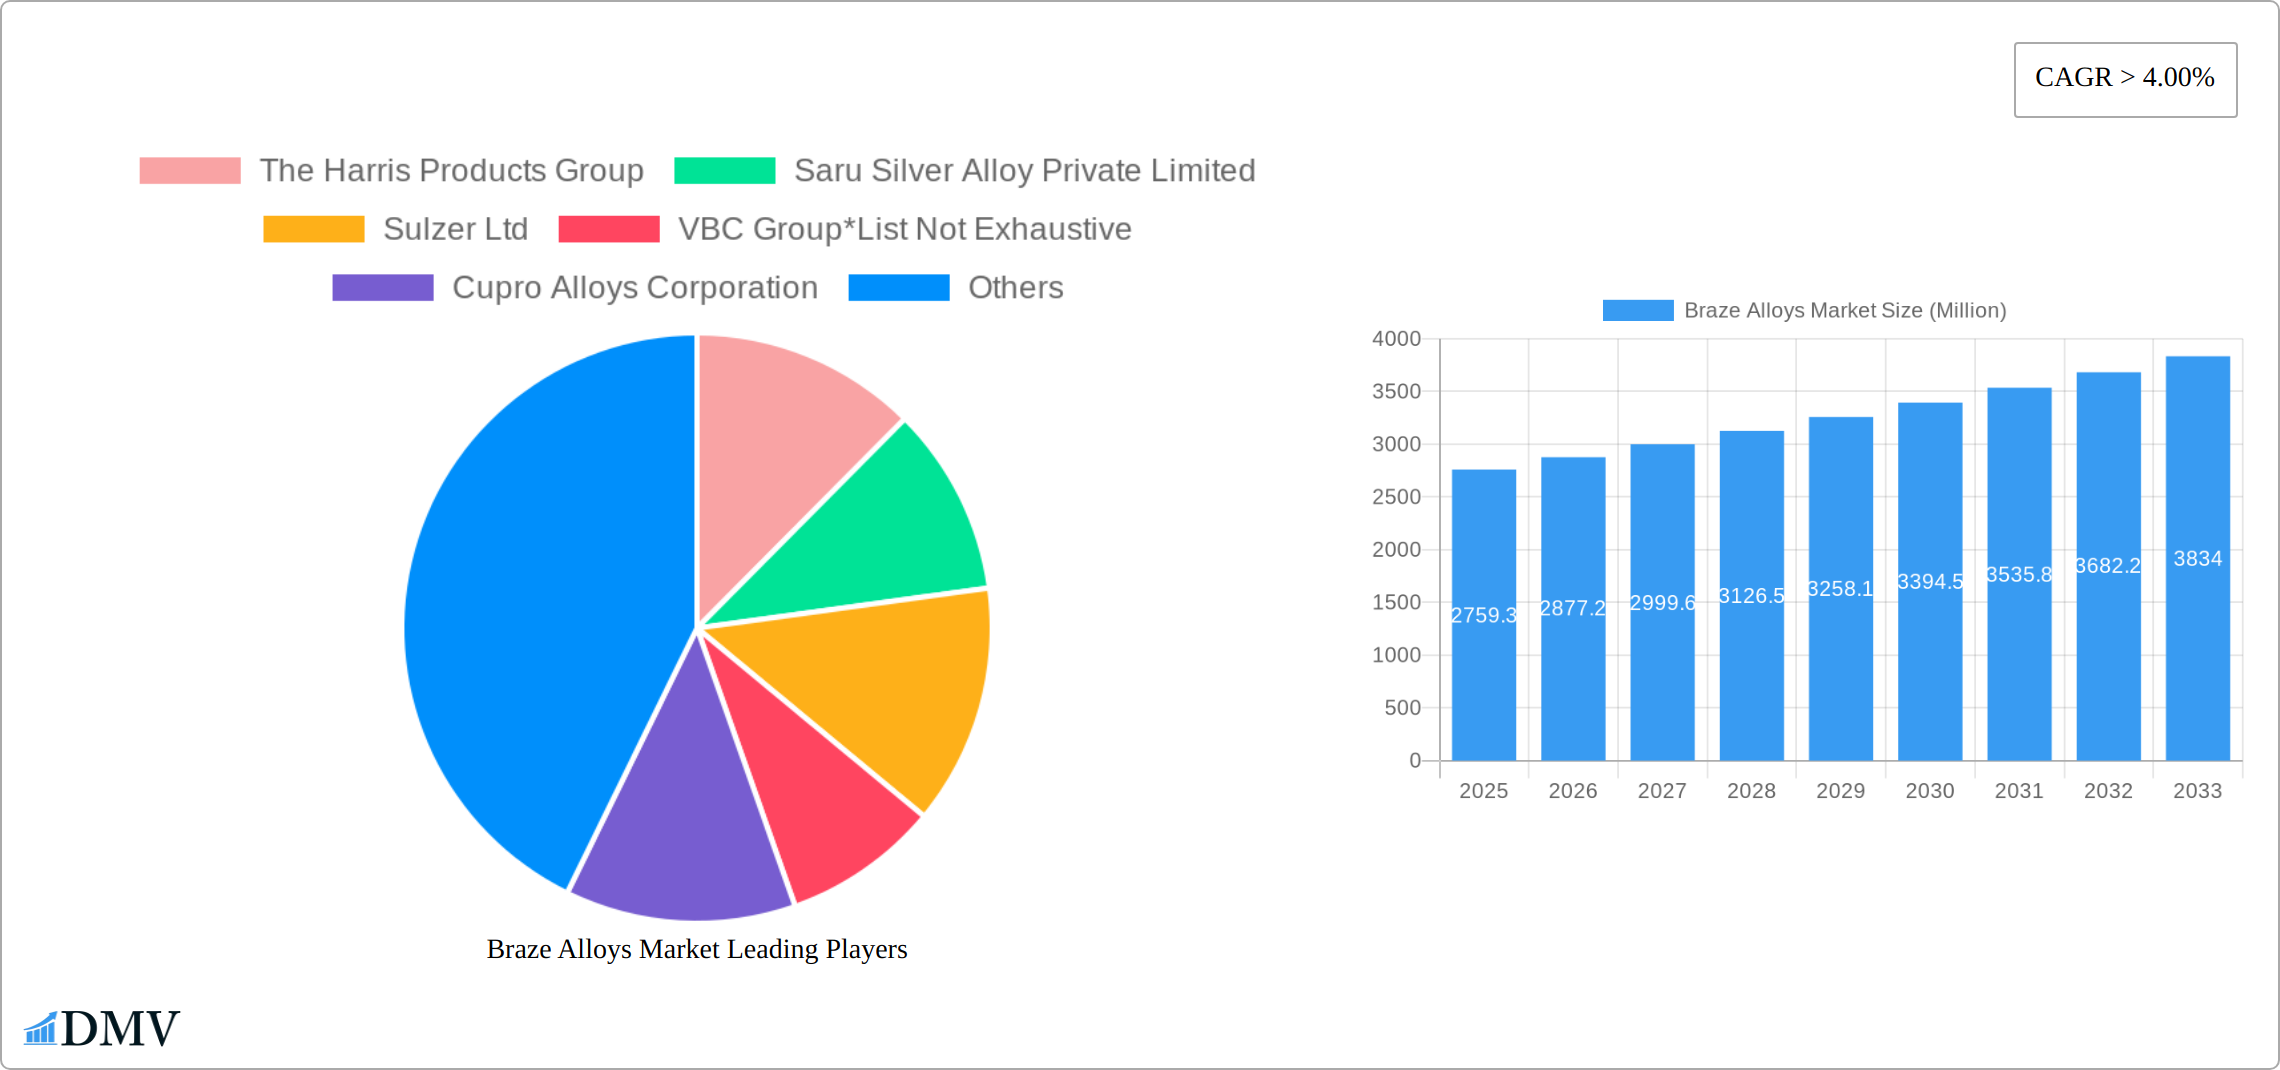
The global braze alloys market, valued at $2759.3 million in 2025, is projected to experience robust growth, exhibiting a Compound Annual Growth Rate (CAGR) exceeding 4% from 2025 to 2033. This expansion is fueled by several key drivers. The burgeoning automotive sector, particularly the increasing adoption of electric vehicles (EVs) requiring advanced brazing technologies for battery packs and electric motor components, significantly contributes to market growth. Similarly, the aerospace and defense industries rely heavily on braze alloys for lightweight yet high-strength components, further bolstering market demand. The electronics industry's continuous miniaturization and the rising adoption of high-frequency circuits also drive the need for precise brazing solutions. Growth is further propelled by the expanding construction industry's demand for durable and reliable brazed components in plumbing, HVAC systems, and other applications. While some challenges exist, such as fluctuating raw material prices and the potential environmental concerns associated with certain alloy compositions, these are being addressed through innovation in material science and sustainable manufacturing processes.
The market segmentation reveals a diverse landscape. Base metals like copper, gold, silver, and aluminum dominate the market, with copper holding a significant share due to its cost-effectiveness and excellent thermal conductivity. The automotive industry represents a major end-user segment, followed by aerospace and defense, electrical and electronics, and construction. Geographically, the Asia-Pacific region, particularly China and India, presents substantial growth opportunities due to rapid industrialization and infrastructure development. North America and Europe also hold significant market shares, driven by established manufacturing bases and technological advancements. Leading companies such as The Harris Products Group, Sulzer Ltd, and Johnson Matthey are actively shaping the market through innovation, acquisitions, and strategic partnerships, continuously improving alloy performance and expanding their market reach. The forecast period (2025-2033) suggests continued expansion, driven by technological innovations and the growing demand from key end-use sectors.
Braze Alloys Market: A Comprehensive Report (2019-2033)
This insightful report provides a comprehensive analysis of the global Braze Alloys market, offering a detailed overview of market trends, competitive landscape, and future growth prospects. The study period spans from 2019 to 2033, with 2025 serving as the base and estimated year. The report is crucial for stakeholders seeking to understand market dynamics, identify growth opportunities, and make informed strategic decisions within this dynamic sector. The market is projected to reach xx Million by 2033, exhibiting a CAGR of xx% during the forecast period (2025-2033).
Braze Alloys Market Composition & Trends
This section delves into the intricate structure of the braze alloys market, examining key aspects that shape its trajectory. We analyze market concentration, revealing the dominance of key players and their respective market share distributions. For example, the top three players (The Harris Products Group, Sulzer Ltd, and Johnson Matthey) collectively hold an estimated xx% market share in 2025. Innovation catalysts, such as advancements in lead-free brazing materials and robotic brazing technologies, are meticulously examined, alongside the regulatory landscape and its impact on market players. The report further explores the role of substitute products and their potential influence on market growth. Finally, an in-depth analysis of M&A activities, including deal values and their strategic implications, is provided. Specific examples include the xx Million acquisition of Company X by Company Y in 2024, highlighting the strategic consolidation within the sector.
- Market Concentration: Highly concentrated, with top players controlling xx% of the market in 2025.
- Innovation Catalysts: Lead-free brazing, robotic brazing, and advancements in copper-based alloys.
- Regulatory Landscape: Analysis of regional regulations impacting material composition and manufacturing processes.
- Substitute Products: Evaluation of alternative joining technologies and their market penetration.
- M&A Activity: Detailed analysis of significant mergers and acquisitions, including deal sizes and strategic rationale.

Braze Alloys Market Industry Evolution
This section traces the evolutionary path of the braze alloys market, highlighting key growth trajectories, technological advancements, and shifting consumer demands. The analysis incorporates historical data from 2019 to 2024, providing a robust foundation for understanding past performance and projecting future growth. The report quantifies market growth rates, examining factors driving expansion and pinpointing specific technological breakthroughs and their impact on market adoption. For example, the adoption rate of robotic brazing systems increased by xx% between 2020 and 2024, illustrating a significant shift in manufacturing processes. The report further analyzes shifting consumer demands, particularly the increasing preference for environmentally friendly, lead-free brazing alloys. The influence of macroeconomic factors, including fluctuations in raw material prices and global economic conditions, are also explored.
Leading Regions, Countries, or Segments in Braze Alloys Market
This section identifies the dominant regions, countries, and segments within the braze alloys market. The analysis focuses on key segments based on base metal (Copper, Gold, Silver, Aluminum, Other Base Metals) and end-user industry (Automotive, Aerospace and Defense, Electrical and Electronics, Construction, Other End-user Industries). The report highlights the factors driving the dominance of specific regions or segments, providing a granular understanding of market dynamics. For example, the strong growth in the automotive sector is attributed to the increasing demand for lightweight vehicles and the adoption of advanced joining technologies.
- Dominant Region: [Region Name] (e.g., North America) due to [Reason, e.g., strong automotive industry, robust R&D].
- Key Drivers in [Dominant Region/Segment]: High capital investments in manufacturing facilities, supportive government regulations promoting advanced manufacturing, and high demand from key end-use sectors.
- Dominant Base Metal: Copper, owing to its cost-effectiveness and excellent brazing properties.
- Dominant End-user Industry: Automotive, driven by the rising demand for lightweight vehicles and electric vehicles.
Braze Alloys Market Product Innovations
Recent innovations in braze alloys have focused on enhancing performance, improving reliability, and meeting stricter environmental regulations. The development of lead-free brazing alloys has significantly impacted the market, addressing environmental concerns and satisfying growing regulatory demands. Furthermore, advancements in alloy composition have led to improved strength, higher melting points, and enhanced corrosion resistance in brazed joints. These innovations have expanded the applications of braze alloys into various sectors, including electronics, aerospace, and medical devices, providing unique selling propositions and competitive advantages for manufacturers.
Propelling Factors for Braze Alloys Market Growth
Several factors are propelling the growth of the braze alloys market. Technological advancements, particularly in robotic brazing and the development of high-performance alloys, are key drivers. Economic factors, including the growth of end-user industries like automotive and electronics, also play a crucial role. Furthermore, supportive government regulations promoting advanced manufacturing and sustainable materials are contributing to market expansion. The increasing demand for lightweight and fuel-efficient vehicles, coupled with the miniaturization of electronic components, further fuels the market's growth.
Obstacles in the Braze Alloys Market Market
Despite the positive growth outlook, several obstacles hinder the braze alloys market. Regulatory challenges, especially concerning the use of hazardous materials, pose significant barriers. Fluctuations in raw material prices and supply chain disruptions can impact production costs and market stability. Intense competition among established players and emerging companies also creates challenges. These factors can lead to price pressures and reduced profit margins for market participants. The market's vulnerability to global economic downturns also presents a significant challenge.
Future Opportunities in Braze Alloys Market
The braze alloys market presents promising opportunities. The expansion into emerging markets with growing industrial sectors offers significant potential. The development of advanced alloys with enhanced properties, such as improved thermal conductivity and fatigue resistance, creates new applications. The increasing demand for sustainable and environmentally friendly brazing materials presents opportunities for manufacturers who can meet these requirements. Furthermore, the integration of advanced manufacturing technologies, such as additive manufacturing, offers potential for innovation and improved efficiency.
Major Players in the Braze Alloys Market Ecosystem
- The Harris Products Group
- Saru Silver Alloy Private Limited
- Sulzer Ltd
- VBC Group
- Cupro Alloys Corporation
- Morgan Advanced Materials
- OC Oerlikon Management AG (Oerlikon Metco)
- Johnson Matthey
- Aimtek Inc
- Prince Izant Company (Bellman-Melcor)
- Indian Solder and Brazing Alloys
- Lucas-Milhaupt Inc
Key Developments in Braze Alloys Market Industry
- 2022 Q4: Launch of a new lead-free brazing alloy by [Company Name], enhancing market competitiveness.
- 2023 Q1: Significant investment in robotic brazing technology by [Company Name], boosting automation levels.
- 2024 Q2: Merger between [Company Name] and [Company Name], consolidating market share. (Note: Replace bracketed information with actual data.)
Strategic Braze Alloys Market Market Forecast
The braze alloys market is poised for continued growth, driven by technological advancements, increasing demand from various end-user industries, and supportive regulatory frameworks. The emergence of new applications and the development of innovative, high-performance alloys will further fuel market expansion. The forecast period from 2025 to 2033 anticipates significant growth, particularly in emerging markets and segments focused on sustainability and advanced manufacturing. Opportunities abound for players capable of adapting to technological advancements and meeting the growing demand for innovative brazing solutions.
Braze Alloys Market Segmentation
-
1. Base Metal
- 1.1. Copper
- 1.2. Gold
- 1.3. Silver
- 1.4. Aluminum
- 1.5. Other Base Metals
-
2. End-user Industry
- 2.1. Automotive
- 2.2. Aerospace and Defense
- 2.3. Electrical and Electronics
- 2.4. Construction
- 2.5. Other End-user Industries
Braze Alloys Market Segmentation By Geography
-
1. Asia Pacific
- 1.1. China
- 1.2. India
- 1.3. Japan
- 1.4. South Korea
- 1.5. Rest of Asia Pacific
-
2. North America
- 2.1. United States
- 2.2. Canada
- 2.3. Mexico
-
3. Europe
- 3.1. Germany
- 3.2. United Kingdom
- 3.3. Italy
- 3.4. France
- 3.5. Spain
- 3.6. Rest of Europe
-
4. South America
- 4.1. Brazil
- 4.2. Argentina
- 4.3. Rest of South America
-
5. Middle East and Africa
- 5.1. Saudi Arabia
- 5.2. South Africa
- 5.3. Rest of Middle East and Africa

Braze Alloys Market REPORT HIGHLIGHTS
| Aspects | Details |
|---|---|
| Study Period | 2019-2033 |
| Base Year | 2024 |
| Estimated Year | 2025 |
| Forecast Period | 2025-2033 |
| Historical Period | 2019-2024 |
| Growth Rate | CAGR of > 4.00% from 2019-2033 |
| Segmentation |
|
Table of Contents
- 1. Introduction
- 1.1. Research Scope
- 1.2. Market Segmentation
- 1.3. Research Methodology
- 1.4. Definitions and Assumptions
- 2. Executive Summary
- 2.1. Introduction
- 3. Market Dynamics
- 3.1. Introduction
- 3.2. Market Drivers
- 3.2.1. Increasing Adoption Rate of Brazing Process Over Processes like Welding and Soldering; Increasing Demand for Aluminum Brazing Alloys from the Automotive Industry
- 3.3. Market Restrains
- 3.3.1. Fluctuating Prices of Base Metals; Other Restraints
- 3.4. Market Trends
- 3.4.1. The Automotive Segment is Expected to Dominate the Market
- 4. Market Factor Analysis
- 4.1. Porters Five Forces
- 4.2. Supply/Value Chain
- 4.3. PESTEL analysis
- 4.4. Market Entropy
- 4.5. Patent/Trademark Analysis
- 5. Global Braze Alloys Market Analysis, Insights and Forecast, 2019-2031
- 5.1. Market Analysis, Insights and Forecast - by Base Metal
- 5.1.1. Copper
- 5.1.2. Gold
- 5.1.3. Silver
- 5.1.4. Aluminum
- 5.1.5. Other Base Metals
- 5.2. Market Analysis, Insights and Forecast - by End-user Industry
- 5.2.1. Automotive
- 5.2.2. Aerospace and Defense
- 5.2.3. Electrical and Electronics
- 5.2.4. Construction
- 5.2.5. Other End-user Industries
- 5.3. Market Analysis, Insights and Forecast - by Region
- 5.3.1. Asia Pacific
- 5.3.2. North America
- 5.3.3. Europe
- 5.3.4. South America
- 5.3.5. Middle East and Africa
- 5.1. Market Analysis, Insights and Forecast - by Base Metal
- 6. Asia Pacific Braze Alloys Market Analysis, Insights and Forecast, 2019-2031
- 6.1. Market Analysis, Insights and Forecast - by Base Metal
- 6.1.1. Copper
- 6.1.2. Gold
- 6.1.3. Silver
- 6.1.4. Aluminum
- 6.1.5. Other Base Metals
- 6.2. Market Analysis, Insights and Forecast - by End-user Industry
- 6.2.1. Automotive
- 6.2.2. Aerospace and Defense
- 6.2.3. Electrical and Electronics
- 6.2.4. Construction
- 6.2.5. Other End-user Industries
- 6.1. Market Analysis, Insights and Forecast - by Base Metal
- 7. North America Braze Alloys Market Analysis, Insights and Forecast, 2019-2031
- 7.1. Market Analysis, Insights and Forecast - by Base Metal
- 7.1.1. Copper
- 7.1.2. Gold
- 7.1.3. Silver
- 7.1.4. Aluminum
- 7.1.5. Other Base Metals
- 7.2. Market Analysis, Insights and Forecast - by End-user Industry
- 7.2.1. Automotive
- 7.2.2. Aerospace and Defense
- 7.2.3. Electrical and Electronics
- 7.2.4. Construction
- 7.2.5. Other End-user Industries
- 7.1. Market Analysis, Insights and Forecast - by Base Metal
- 8. Europe Braze Alloys Market Analysis, Insights and Forecast, 2019-2031
- 8.1. Market Analysis, Insights and Forecast - by Base Metal
- 8.1.1. Copper
- 8.1.2. Gold
- 8.1.3. Silver
- 8.1.4. Aluminum
- 8.1.5. Other Base Metals
- 8.2. Market Analysis, Insights and Forecast - by End-user Industry
- 8.2.1. Automotive
- 8.2.2. Aerospace and Defense
- 8.2.3. Electrical and Electronics
- 8.2.4. Construction
- 8.2.5. Other End-user Industries
- 8.1. Market Analysis, Insights and Forecast - by Base Metal
- 9. South America Braze Alloys Market Analysis, Insights and Forecast, 2019-2031
- 9.1. Market Analysis, Insights and Forecast - by Base Metal
- 9.1.1. Copper
- 9.1.2. Gold
- 9.1.3. Silver
- 9.1.4. Aluminum
- 9.1.5. Other Base Metals
- 9.2. Market Analysis, Insights and Forecast - by End-user Industry
- 9.2.1. Automotive
- 9.2.2. Aerospace and Defense
- 9.2.3. Electrical and Electronics
- 9.2.4. Construction
- 9.2.5. Other End-user Industries
- 9.1. Market Analysis, Insights and Forecast - by Base Metal
- 10. Middle East and Africa Braze Alloys Market Analysis, Insights and Forecast, 2019-2031
- 10.1. Market Analysis, Insights and Forecast - by Base Metal
- 10.1.1. Copper
- 10.1.2. Gold
- 10.1.3. Silver
- 10.1.4. Aluminum
- 10.1.5. Other Base Metals
- 10.2. Market Analysis, Insights and Forecast - by End-user Industry
- 10.2.1. Automotive
- 10.2.2. Aerospace and Defense
- 10.2.3. Electrical and Electronics
- 10.2.4. Construction
- 10.2.5. Other End-user Industries
- 10.1. Market Analysis, Insights and Forecast - by Base Metal
- 11. Asia Pacific Braze Alloys Market Analysis, Insights and Forecast, 2019-2031
- 11.1. Market Analysis, Insights and Forecast - By Country/Sub-region
- 11.1.1 China
- 11.1.2 India
- 11.1.3 Japan
- 11.1.4 South Korea
- 11.1.5 Rest of Asia Pacific
- 12. North America Braze Alloys Market Analysis, Insights and Forecast, 2019-2031
- 12.1. Market Analysis, Insights and Forecast - By Country/Sub-region
- 12.1.1 United States
- 12.1.2 Canada
- 12.1.3 Mexico
- 13. Europe Braze Alloys Market Analysis, Insights and Forecast, 2019-2031
- 13.1. Market Analysis, Insights and Forecast - By Country/Sub-region
- 13.1.1 Germany
- 13.1.2 United Kingdom
- 13.1.3 Italy
- 13.1.4 France
- 13.1.5 Spain
- 13.1.6 Rest of Europe
- 14. South America Braze Alloys Market Analysis, Insights and Forecast, 2019-2031
- 14.1. Market Analysis, Insights and Forecast - By Country/Sub-region
- 14.1.1 Brazil
- 14.1.2 Argentina
- 14.1.3 Rest of South America
- 15. Middle East and Africa Braze Alloys Market Analysis, Insights and Forecast, 2019-2031
- 15.1. Market Analysis, Insights and Forecast - By Country/Sub-region
- 15.1.1 Saudi Arabia
- 15.1.2 South Africa
- 15.1.3 Rest of Middle East and Africa
- 16. Competitive Analysis
- 16.1. Global Market Share Analysis 2024
- 16.2. Company Profiles
- 16.2.1 The Harris Products Group
- 16.2.1.1. Overview
- 16.2.1.2. Products
- 16.2.1.3. SWOT Analysis
- 16.2.1.4. Recent Developments
- 16.2.1.5. Financials (Based on Availability)
- 16.2.2 Saru Silver Alloy Private Limited
- 16.2.2.1. Overview
- 16.2.2.2. Products
- 16.2.2.3. SWOT Analysis
- 16.2.2.4. Recent Developments
- 16.2.2.5. Financials (Based on Availability)
- 16.2.3 Sulzer Ltd
- 16.2.3.1. Overview
- 16.2.3.2. Products
- 16.2.3.3. SWOT Analysis
- 16.2.3.4. Recent Developments
- 16.2.3.5. Financials (Based on Availability)
- 16.2.4 VBC Group*List Not Exhaustive
- 16.2.4.1. Overview
- 16.2.4.2. Products
- 16.2.4.3. SWOT Analysis
- 16.2.4.4. Recent Developments
- 16.2.4.5. Financials (Based on Availability)
- 16.2.5 Cupro Alloys Corporation
- 16.2.5.1. Overview
- 16.2.5.2. Products
- 16.2.5.3. SWOT Analysis
- 16.2.5.4. Recent Developments
- 16.2.5.5. Financials (Based on Availability)
- 16.2.6 Morgan Advanced Materials
- 16.2.6.1. Overview
- 16.2.6.2. Products
- 16.2.6.3. SWOT Analysis
- 16.2.6.4. Recent Developments
- 16.2.6.5. Financials (Based on Availability)
- 16.2.7 OC Oerlikon Management AG (Oerlikon Metco)
- 16.2.7.1. Overview
- 16.2.7.2. Products
- 16.2.7.3. SWOT Analysis
- 16.2.7.4. Recent Developments
- 16.2.7.5. Financials (Based on Availability)
- 16.2.8 Johnson Matthey
- 16.2.8.1. Overview
- 16.2.8.2. Products
- 16.2.8.3. SWOT Analysis
- 16.2.8.4. Recent Developments
- 16.2.8.5. Financials (Based on Availability)
- 16.2.9 Aimtek Inc
- 16.2.9.1. Overview
- 16.2.9.2. Products
- 16.2.9.3. SWOT Analysis
- 16.2.9.4. Recent Developments
- 16.2.9.5. Financials (Based on Availability)
- 16.2.10 Prince Izant Company (Bellman-Melcor)
- 16.2.10.1. Overview
- 16.2.10.2. Products
- 16.2.10.3. SWOT Analysis
- 16.2.10.4. Recent Developments
- 16.2.10.5. Financials (Based on Availability)
- 16.2.11 Indian Solder and Brazing Alloys
- 16.2.11.1. Overview
- 16.2.11.2. Products
- 16.2.11.3. SWOT Analysis
- 16.2.11.4. Recent Developments
- 16.2.11.5. Financials (Based on Availability)
- 16.2.12 Lucas-Milhaupt Inc
- 16.2.12.1. Overview
- 16.2.12.2. Products
- 16.2.12.3. SWOT Analysis
- 16.2.12.4. Recent Developments
- 16.2.12.5. Financials (Based on Availability)
- 16.2.1 The Harris Products Group
List of Figures
- Figure 1: Global Braze Alloys Market Revenue Breakdown (Million, %) by Region 2024 & 2032
- Figure 2: Global Braze Alloys Market Volume Breakdown (K Tons, %) by Region 2024 & 2032
- Figure 3: Asia Pacific Braze Alloys Market Revenue (Million), by Country 2024 & 2032
- Figure 4: Asia Pacific Braze Alloys Market Volume (K Tons), by Country 2024 & 2032
- Figure 5: Asia Pacific Braze Alloys Market Revenue Share (%), by Country 2024 & 2032
- Figure 6: Asia Pacific Braze Alloys Market Volume Share (%), by Country 2024 & 2032
- Figure 7: North America Braze Alloys Market Revenue (Million), by Country 2024 & 2032
- Figure 8: North America Braze Alloys Market Volume (K Tons), by Country 2024 & 2032
- Figure 9: North America Braze Alloys Market Revenue Share (%), by Country 2024 & 2032
- Figure 10: North America Braze Alloys Market Volume Share (%), by Country 2024 & 2032
- Figure 11: Europe Braze Alloys Market Revenue (Million), by Country 2024 & 2032
- Figure 12: Europe Braze Alloys Market Volume (K Tons), by Country 2024 & 2032
- Figure 13: Europe Braze Alloys Market Revenue Share (%), by Country 2024 & 2032
- Figure 14: Europe Braze Alloys Market Volume Share (%), by Country 2024 & 2032
- Figure 15: South America Braze Alloys Market Revenue (Million), by Country 2024 & 2032
- Figure 16: South America Braze Alloys Market Volume (K Tons), by Country 2024 & 2032
- Figure 17: South America Braze Alloys Market Revenue Share (%), by Country 2024 & 2032
- Figure 18: South America Braze Alloys Market Volume Share (%), by Country 2024 & 2032
- Figure 19: Middle East and Africa Braze Alloys Market Revenue (Million), by Country 2024 & 2032
- Figure 20: Middle East and Africa Braze Alloys Market Volume (K Tons), by Country 2024 & 2032
- Figure 21: Middle East and Africa Braze Alloys Market Revenue Share (%), by Country 2024 & 2032
- Figure 22: Middle East and Africa Braze Alloys Market Volume Share (%), by Country 2024 & 2032
- Figure 23: Asia Pacific Braze Alloys Market Revenue (Million), by Base Metal 2024 & 2032
- Figure 24: Asia Pacific Braze Alloys Market Volume (K Tons), by Base Metal 2024 & 2032
- Figure 25: Asia Pacific Braze Alloys Market Revenue Share (%), by Base Metal 2024 & 2032
- Figure 26: Asia Pacific Braze Alloys Market Volume Share (%), by Base Metal 2024 & 2032
- Figure 27: Asia Pacific Braze Alloys Market Revenue (Million), by End-user Industry 2024 & 2032
- Figure 28: Asia Pacific Braze Alloys Market Volume (K Tons), by End-user Industry 2024 & 2032
- Figure 29: Asia Pacific Braze Alloys Market Revenue Share (%), by End-user Industry 2024 & 2032
- Figure 30: Asia Pacific Braze Alloys Market Volume Share (%), by End-user Industry 2024 & 2032
- Figure 31: Asia Pacific Braze Alloys Market Revenue (Million), by Country 2024 & 2032
- Figure 32: Asia Pacific Braze Alloys Market Volume (K Tons), by Country 2024 & 2032
- Figure 33: Asia Pacific Braze Alloys Market Revenue Share (%), by Country 2024 & 2032
- Figure 34: Asia Pacific Braze Alloys Market Volume Share (%), by Country 2024 & 2032
- Figure 35: North America Braze Alloys Market Revenue (Million), by Base Metal 2024 & 2032
- Figure 36: North America Braze Alloys Market Volume (K Tons), by Base Metal 2024 & 2032
- Figure 37: North America Braze Alloys Market Revenue Share (%), by Base Metal 2024 & 2032
- Figure 38: North America Braze Alloys Market Volume Share (%), by Base Metal 2024 & 2032
- Figure 39: North America Braze Alloys Market Revenue (Million), by End-user Industry 2024 & 2032
- Figure 40: North America Braze Alloys Market Volume (K Tons), by End-user Industry 2024 & 2032
- Figure 41: North America Braze Alloys Market Revenue Share (%), by End-user Industry 2024 & 2032
- Figure 42: North America Braze Alloys Market Volume Share (%), by End-user Industry 2024 & 2032
- Figure 43: North America Braze Alloys Market Revenue (Million), by Country 2024 & 2032
- Figure 44: North America Braze Alloys Market Volume (K Tons), by Country 2024 & 2032
- Figure 45: North America Braze Alloys Market Revenue Share (%), by Country 2024 & 2032
- Figure 46: North America Braze Alloys Market Volume Share (%), by Country 2024 & 2032
- Figure 47: Europe Braze Alloys Market Revenue (Million), by Base Metal 2024 & 2032
- Figure 48: Europe Braze Alloys Market Volume (K Tons), by Base Metal 2024 & 2032
- Figure 49: Europe Braze Alloys Market Revenue Share (%), by Base Metal 2024 & 2032
- Figure 50: Europe Braze Alloys Market Volume Share (%), by Base Metal 2024 & 2032
- Figure 51: Europe Braze Alloys Market Revenue (Million), by End-user Industry 2024 & 2032
- Figure 52: Europe Braze Alloys Market Volume (K Tons), by End-user Industry 2024 & 2032
- Figure 53: Europe Braze Alloys Market Revenue Share (%), by End-user Industry 2024 & 2032
- Figure 54: Europe Braze Alloys Market Volume Share (%), by End-user Industry 2024 & 2032
- Figure 55: Europe Braze Alloys Market Revenue (Million), by Country 2024 & 2032
- Figure 56: Europe Braze Alloys Market Volume (K Tons), by Country 2024 & 2032
- Figure 57: Europe Braze Alloys Market Revenue Share (%), by Country 2024 & 2032
- Figure 58: Europe Braze Alloys Market Volume Share (%), by Country 2024 & 2032
- Figure 59: South America Braze Alloys Market Revenue (Million), by Base Metal 2024 & 2032
- Figure 60: South America Braze Alloys Market Volume (K Tons), by Base Metal 2024 & 2032
- Figure 61: South America Braze Alloys Market Revenue Share (%), by Base Metal 2024 & 2032
- Figure 62: South America Braze Alloys Market Volume Share (%), by Base Metal 2024 & 2032
- Figure 63: South America Braze Alloys Market Revenue (Million), by End-user Industry 2024 & 2032
- Figure 64: South America Braze Alloys Market Volume (K Tons), by End-user Industry 2024 & 2032
- Figure 65: South America Braze Alloys Market Revenue Share (%), by End-user Industry 2024 & 2032
- Figure 66: South America Braze Alloys Market Volume Share (%), by End-user Industry 2024 & 2032
- Figure 67: South America Braze Alloys Market Revenue (Million), by Country 2024 & 2032
- Figure 68: South America Braze Alloys Market Volume (K Tons), by Country 2024 & 2032
- Figure 69: South America Braze Alloys Market Revenue Share (%), by Country 2024 & 2032
- Figure 70: South America Braze Alloys Market Volume Share (%), by Country 2024 & 2032
- Figure 71: Middle East and Africa Braze Alloys Market Revenue (Million), by Base Metal 2024 & 2032
- Figure 72: Middle East and Africa Braze Alloys Market Volume (K Tons), by Base Metal 2024 & 2032
- Figure 73: Middle East and Africa Braze Alloys Market Revenue Share (%), by Base Metal 2024 & 2032
- Figure 74: Middle East and Africa Braze Alloys Market Volume Share (%), by Base Metal 2024 & 2032
- Figure 75: Middle East and Africa Braze Alloys Market Revenue (Million), by End-user Industry 2024 & 2032
- Figure 76: Middle East and Africa Braze Alloys Market Volume (K Tons), by End-user Industry 2024 & 2032
- Figure 77: Middle East and Africa Braze Alloys Market Revenue Share (%), by End-user Industry 2024 & 2032
- Figure 78: Middle East and Africa Braze Alloys Market Volume Share (%), by End-user Industry 2024 & 2032
- Figure 79: Middle East and Africa Braze Alloys Market Revenue (Million), by Country 2024 & 2032
- Figure 80: Middle East and Africa Braze Alloys Market Volume (K Tons), by Country 2024 & 2032
- Figure 81: Middle East and Africa Braze Alloys Market Revenue Share (%), by Country 2024 & 2032
- Figure 82: Middle East and Africa Braze Alloys Market Volume Share (%), by Country 2024 & 2032
List of Tables
- Table 1: Global Braze Alloys Market Revenue Million Forecast, by Region 2019 & 2032
- Table 2: Global Braze Alloys Market Volume K Tons Forecast, by Region 2019 & 2032
- Table 3: Global Braze Alloys Market Revenue Million Forecast, by Base Metal 2019 & 2032
- Table 4: Global Braze Alloys Market Volume K Tons Forecast, by Base Metal 2019 & 2032
- Table 5: Global Braze Alloys Market Revenue Million Forecast, by End-user Industry 2019 & 2032
- Table 6: Global Braze Alloys Market Volume K Tons Forecast, by End-user Industry 2019 & 2032
- Table 7: Global Braze Alloys Market Revenue Million Forecast, by Region 2019 & 2032
- Table 8: Global Braze Alloys Market Volume K Tons Forecast, by Region 2019 & 2032
- Table 9: Global Braze Alloys Market Revenue Million Forecast, by Country 2019 & 2032
- Table 10: Global Braze Alloys Market Volume K Tons Forecast, by Country 2019 & 2032
- Table 11: China Braze Alloys Market Revenue (Million) Forecast, by Application 2019 & 2032
- Table 12: China Braze Alloys Market Volume (K Tons) Forecast, by Application 2019 & 2032
- Table 13: India Braze Alloys Market Revenue (Million) Forecast, by Application 2019 & 2032
- Table 14: India Braze Alloys Market Volume (K Tons) Forecast, by Application 2019 & 2032
- Table 15: Japan Braze Alloys Market Revenue (Million) Forecast, by Application 2019 & 2032
- Table 16: Japan Braze Alloys Market Volume (K Tons) Forecast, by Application 2019 & 2032
- Table 17: South Korea Braze Alloys Market Revenue (Million) Forecast, by Application 2019 & 2032
- Table 18: South Korea Braze Alloys Market Volume (K Tons) Forecast, by Application 2019 & 2032
- Table 19: Rest of Asia Pacific Braze Alloys Market Revenue (Million) Forecast, by Application 2019 & 2032
- Table 20: Rest of Asia Pacific Braze Alloys Market Volume (K Tons) Forecast, by Application 2019 & 2032
- Table 21: Global Braze Alloys Market Revenue Million Forecast, by Country 2019 & 2032
- Table 22: Global Braze Alloys Market Volume K Tons Forecast, by Country 2019 & 2032
- Table 23: United States Braze Alloys Market Revenue (Million) Forecast, by Application 2019 & 2032
- Table 24: United States Braze Alloys Market Volume (K Tons) Forecast, by Application 2019 & 2032
- Table 25: Canada Braze Alloys Market Revenue (Million) Forecast, by Application 2019 & 2032
- Table 26: Canada Braze Alloys Market Volume (K Tons) Forecast, by Application 2019 & 2032
- Table 27: Mexico Braze Alloys Market Revenue (Million) Forecast, by Application 2019 & 2032
- Table 28: Mexico Braze Alloys Market Volume (K Tons) Forecast, by Application 2019 & 2032
- Table 29: Global Braze Alloys Market Revenue Million Forecast, by Country 2019 & 2032
- Table 30: Global Braze Alloys Market Volume K Tons Forecast, by Country 2019 & 2032
- Table 31: Germany Braze Alloys Market Revenue (Million) Forecast, by Application 2019 & 2032
- Table 32: Germany Braze Alloys Market Volume (K Tons) Forecast, by Application 2019 & 2032
- Table 33: United Kingdom Braze Alloys Market Revenue (Million) Forecast, by Application 2019 & 2032
- Table 34: United Kingdom Braze Alloys Market Volume (K Tons) Forecast, by Application 2019 & 2032
- Table 35: Italy Braze Alloys Market Revenue (Million) Forecast, by Application 2019 & 2032
- Table 36: Italy Braze Alloys Market Volume (K Tons) Forecast, by Application 2019 & 2032
- Table 37: France Braze Alloys Market Revenue (Million) Forecast, by Application 2019 & 2032
- Table 38: France Braze Alloys Market Volume (K Tons) Forecast, by Application 2019 & 2032
- Table 39: Spain Braze Alloys Market Revenue (Million) Forecast, by Application 2019 & 2032
- Table 40: Spain Braze Alloys Market Volume (K Tons) Forecast, by Application 2019 & 2032
- Table 41: Rest of Europe Braze Alloys Market Revenue (Million) Forecast, by Application 2019 & 2032
- Table 42: Rest of Europe Braze Alloys Market Volume (K Tons) Forecast, by Application 2019 & 2032
- Table 43: Global Braze Alloys Market Revenue Million Forecast, by Country 2019 & 2032
- Table 44: Global Braze Alloys Market Volume K Tons Forecast, by Country 2019 & 2032
- Table 45: Brazil Braze Alloys Market Revenue (Million) Forecast, by Application 2019 & 2032
- Table 46: Brazil Braze Alloys Market Volume (K Tons) Forecast, by Application 2019 & 2032
- Table 47: Argentina Braze Alloys Market Revenue (Million) Forecast, by Application 2019 & 2032
- Table 48: Argentina Braze Alloys Market Volume (K Tons) Forecast, by Application 2019 & 2032
- Table 49: Rest of South America Braze Alloys Market Revenue (Million) Forecast, by Application 2019 & 2032
- Table 50: Rest of South America Braze Alloys Market Volume (K Tons) Forecast, by Application 2019 & 2032
- Table 51: Global Braze Alloys Market Revenue Million Forecast, by Country 2019 & 2032
- Table 52: Global Braze Alloys Market Volume K Tons Forecast, by Country 2019 & 2032
- Table 53: Saudi Arabia Braze Alloys Market Revenue (Million) Forecast, by Application 2019 & 2032
- Table 54: Saudi Arabia Braze Alloys Market Volume (K Tons) Forecast, by Application 2019 & 2032
- Table 55: South Africa Braze Alloys Market Revenue (Million) Forecast, by Application 2019 & 2032
- Table 56: South Africa Braze Alloys Market Volume (K Tons) Forecast, by Application 2019 & 2032
- Table 57: Rest of Middle East and Africa Braze Alloys Market Revenue (Million) Forecast, by Application 2019 & 2032
- Table 58: Rest of Middle East and Africa Braze Alloys Market Volume (K Tons) Forecast, by Application 2019 & 2032
- Table 59: Global Braze Alloys Market Revenue Million Forecast, by Base Metal 2019 & 2032
- Table 60: Global Braze Alloys Market Volume K Tons Forecast, by Base Metal 2019 & 2032
- Table 61: Global Braze Alloys Market Revenue Million Forecast, by End-user Industry 2019 & 2032
- Table 62: Global Braze Alloys Market Volume K Tons Forecast, by End-user Industry 2019 & 2032
- Table 63: Global Braze Alloys Market Revenue Million Forecast, by Country 2019 & 2032
- Table 64: Global Braze Alloys Market Volume K Tons Forecast, by Country 2019 & 2032
- Table 65: China Braze Alloys Market Revenue (Million) Forecast, by Application 2019 & 2032
- Table 66: China Braze Alloys Market Volume (K Tons) Forecast, by Application 2019 & 2032
- Table 67: India Braze Alloys Market Revenue (Million) Forecast, by Application 2019 & 2032
- Table 68: India Braze Alloys Market Volume (K Tons) Forecast, by Application 2019 & 2032
- Table 69: Japan Braze Alloys Market Revenue (Million) Forecast, by Application 2019 & 2032
- Table 70: Japan Braze Alloys Market Volume (K Tons) Forecast, by Application 2019 & 2032
- Table 71: South Korea Braze Alloys Market Revenue (Million) Forecast, by Application 2019 & 2032
- Table 72: South Korea Braze Alloys Market Volume (K Tons) Forecast, by Application 2019 & 2032
- Table 73: Rest of Asia Pacific Braze Alloys Market Revenue (Million) Forecast, by Application 2019 & 2032
- Table 74: Rest of Asia Pacific Braze Alloys Market Volume (K Tons) Forecast, by Application 2019 & 2032
- Table 75: Global Braze Alloys Market Revenue Million Forecast, by Base Metal 2019 & 2032
- Table 76: Global Braze Alloys Market Volume K Tons Forecast, by Base Metal 2019 & 2032
- Table 77: Global Braze Alloys Market Revenue Million Forecast, by End-user Industry 2019 & 2032
- Table 78: Global Braze Alloys Market Volume K Tons Forecast, by End-user Industry 2019 & 2032
- Table 79: Global Braze Alloys Market Revenue Million Forecast, by Country 2019 & 2032
- Table 80: Global Braze Alloys Market Volume K Tons Forecast, by Country 2019 & 2032
- Table 81: United States Braze Alloys Market Revenue (Million) Forecast, by Application 2019 & 2032
- Table 82: United States Braze Alloys Market Volume (K Tons) Forecast, by Application 2019 & 2032
- Table 83: Canada Braze Alloys Market Revenue (Million) Forecast, by Application 2019 & 2032
- Table 84: Canada Braze Alloys Market Volume (K Tons) Forecast, by Application 2019 & 2032
- Table 85: Mexico Braze Alloys Market Revenue (Million) Forecast, by Application 2019 & 2032
- Table 86: Mexico Braze Alloys Market Volume (K Tons) Forecast, by Application 2019 & 2032
- Table 87: Global Braze Alloys Market Revenue Million Forecast, by Base Metal 2019 & 2032
- Table 88: Global Braze Alloys Market Volume K Tons Forecast, by Base Metal 2019 & 2032
- Table 89: Global Braze Alloys Market Revenue Million Forecast, by End-user Industry 2019 & 2032
- Table 90: Global Braze Alloys Market Volume K Tons Forecast, by End-user Industry 2019 & 2032
- Table 91: Global Braze Alloys Market Revenue Million Forecast, by Country 2019 & 2032
- Table 92: Global Braze Alloys Market Volume K Tons Forecast, by Country 2019 & 2032
- Table 93: Germany Braze Alloys Market Revenue (Million) Forecast, by Application 2019 & 2032
- Table 94: Germany Braze Alloys Market Volume (K Tons) Forecast, by Application 2019 & 2032
- Table 95: United Kingdom Braze Alloys Market Revenue (Million) Forecast, by Application 2019 & 2032
- Table 96: United Kingdom Braze Alloys Market Volume (K Tons) Forecast, by Application 2019 & 2032
- Table 97: Italy Braze Alloys Market Revenue (Million) Forecast, by Application 2019 & 2032
- Table 98: Italy Braze Alloys Market Volume (K Tons) Forecast, by Application 2019 & 2032
- Table 99: France Braze Alloys Market Revenue (Million) Forecast, by Application 2019 & 2032
- Table 100: France Braze Alloys Market Volume (K Tons) Forecast, by Application 2019 & 2032
- Table 101: Spain Braze Alloys Market Revenue (Million) Forecast, by Application 2019 & 2032
- Table 102: Spain Braze Alloys Market Volume (K Tons) Forecast, by Application 2019 & 2032
- Table 103: Rest of Europe Braze Alloys Market Revenue (Million) Forecast, by Application 2019 & 2032
- Table 104: Rest of Europe Braze Alloys Market Volume (K Tons) Forecast, by Application 2019 & 2032
- Table 105: Global Braze Alloys Market Revenue Million Forecast, by Base Metal 2019 & 2032
- Table 106: Global Braze Alloys Market Volume K Tons Forecast, by Base Metal 2019 & 2032
- Table 107: Global Braze Alloys Market Revenue Million Forecast, by End-user Industry 2019 & 2032
- Table 108: Global Braze Alloys Market Volume K Tons Forecast, by End-user Industry 2019 & 2032
- Table 109: Global Braze Alloys Market Revenue Million Forecast, by Country 2019 & 2032
- Table 110: Global Braze Alloys Market Volume K Tons Forecast, by Country 2019 & 2032
- Table 111: Brazil Braze Alloys Market Revenue (Million) Forecast, by Application 2019 & 2032
- Table 112: Brazil Braze Alloys Market Volume (K Tons) Forecast, by Application 2019 & 2032
- Table 113: Argentina Braze Alloys Market Revenue (Million) Forecast, by Application 2019 & 2032
- Table 114: Argentina Braze Alloys Market Volume (K Tons) Forecast, by Application 2019 & 2032
- Table 115: Rest of South America Braze Alloys Market Revenue (Million) Forecast, by Application 2019 & 2032
- Table 116: Rest of South America Braze Alloys Market Volume (K Tons) Forecast, by Application 2019 & 2032
- Table 117: Global Braze Alloys Market Revenue Million Forecast, by Base Metal 2019 & 2032
- Table 118: Global Braze Alloys Market Volume K Tons Forecast, by Base Metal 2019 & 2032
- Table 119: Global Braze Alloys Market Revenue Million Forecast, by End-user Industry 2019 & 2032
- Table 120: Global Braze Alloys Market Volume K Tons Forecast, by End-user Industry 2019 & 2032
- Table 121: Global Braze Alloys Market Revenue Million Forecast, by Country 2019 & 2032
- Table 122: Global Braze Alloys Market Volume K Tons Forecast, by Country 2019 & 2032
- Table 123: Saudi Arabia Braze Alloys Market Revenue (Million) Forecast, by Application 2019 & 2032
- Table 124: Saudi Arabia Braze Alloys Market Volume (K Tons) Forecast, by Application 2019 & 2032
- Table 125: South Africa Braze Alloys Market Revenue (Million) Forecast, by Application 2019 & 2032
- Table 126: South Africa Braze Alloys Market Volume (K Tons) Forecast, by Application 2019 & 2032
- Table 127: Rest of Middle East and Africa Braze Alloys Market Revenue (Million) Forecast, by Application 2019 & 2032
- Table 128: Rest of Middle East and Africa Braze Alloys Market Volume (K Tons) Forecast, by Application 2019 & 2032
Frequently Asked Questions
1. What is the projected Compound Annual Growth Rate (CAGR) of the Braze Alloys Market?
The projected CAGR is approximately > 4.00%.
2. Which companies are prominent players in the Braze Alloys Market?
Key companies in the market include The Harris Products Group, Saru Silver Alloy Private Limited, Sulzer Ltd, VBC Group*List Not Exhaustive, Cupro Alloys Corporation, Morgan Advanced Materials, OC Oerlikon Management AG (Oerlikon Metco), Johnson Matthey, Aimtek Inc, Prince Izant Company (Bellman-Melcor), Indian Solder and Brazing Alloys, Lucas-Milhaupt Inc.
3. What are the main segments of the Braze Alloys Market?
The market segments include Base Metal, End-user Industry.
4. Can you provide details about the market size?
The market size is estimated to be USD 2759.3 Million as of 2022.
5. What are some drivers contributing to market growth?
Increasing Adoption Rate of Brazing Process Over Processes like Welding and Soldering; Increasing Demand for Aluminum Brazing Alloys from the Automotive Industry.
6. What are the notable trends driving market growth?
The Automotive Segment is Expected to Dominate the Market.
7. Are there any restraints impacting market growth?
Fluctuating Prices of Base Metals; Other Restraints.
8. Can you provide examples of recent developments in the market?
The Braze Alloys sector has experienced several significant developments in recent years. The major developments include the increasing demand for lead-free brazing materials, the growing popularity of robotic brazing, and the increasing demand for copper-based brazing materials.
9. What pricing options are available for accessing the report?
Pricing options include single-user, multi-user, and enterprise licenses priced at USD 4750, USD 5250, and USD 8750 respectively.
10. Is the market size provided in terms of value or volume?
The market size is provided in terms of value, measured in Million and volume, measured in K Tons.
11. Are there any specific market keywords associated with the report?
Yes, the market keyword associated with the report is "Braze Alloys Market," which aids in identifying and referencing the specific market segment covered.
12. How do I determine which pricing option suits my needs best?
The pricing options vary based on user requirements and access needs. Individual users may opt for single-user licenses, while businesses requiring broader access may choose multi-user or enterprise licenses for cost-effective access to the report.
13. Are there any additional resources or data provided in the Braze Alloys Market report?
While the report offers comprehensive insights, it's advisable to review the specific contents or supplementary materials provided to ascertain if additional resources or data are available.
14. How can I stay updated on further developments or reports in the Braze Alloys Market?
To stay informed about further developments, trends, and reports in the Braze Alloys Market, consider subscribing to industry newsletters, following relevant companies and organizations, or regularly checking reputable industry news sources and publications.
Methodology
Step 1 - Identification of Relevant Samples Size from Population Database


Step 2 - Approaches for Defining Global Market Size (Value, Volume* & Price*)

Note*: In applicable scenarios
Step 3 - Data Sources
Primary Research
- Web Analytics
- Survey Reports
- Research Institute
- Latest Research Reports
- Opinion Leaders
Secondary Research
- Annual Reports
- White Paper
- Latest Press Release
- Industry Association
- Paid Database
- Investor Presentations

Step 4 - Data Triangulation
Involves using different sources of information in order to increase the validity of a study
These sources are likely to be stakeholders in a program - participants, other researchers, program staff, other community members, and so on.
Then we put all data in single framework & apply various statistical tools to find out the dynamic on the market.
During the analysis stage, feedback from the stakeholder groups would be compared to determine areas of agreement as well as areas of divergence
