

Key Insights
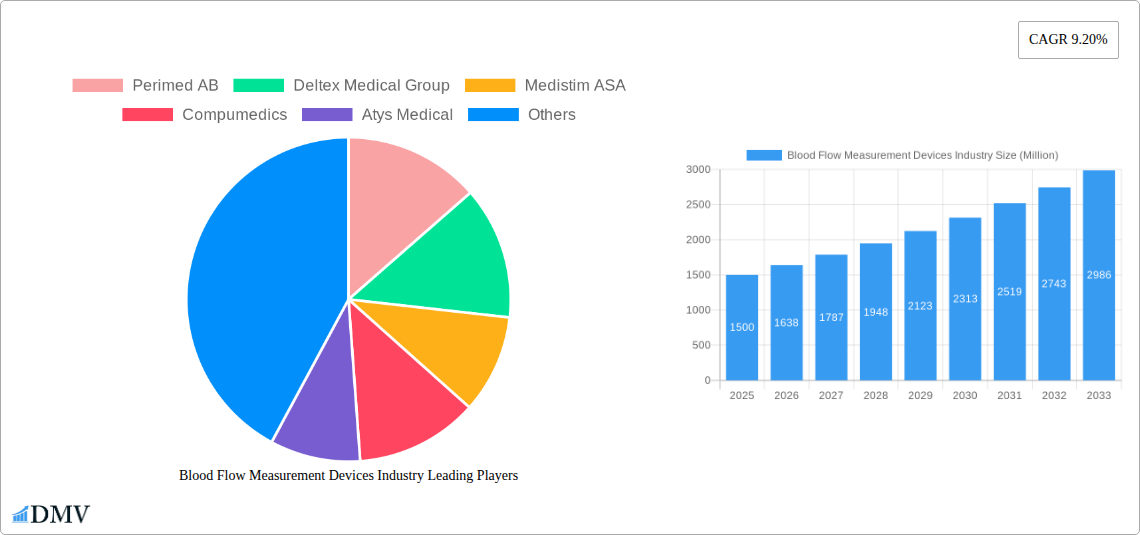
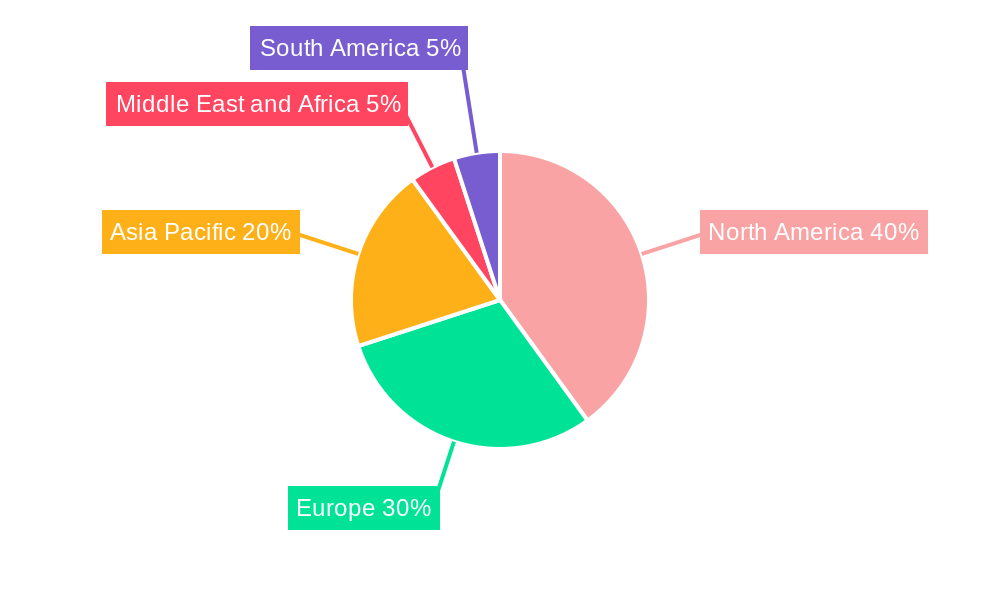
The global blood flow measurement devices market is experiencing robust growth, projected to reach a substantial size driven by several key factors. The 9.20% CAGR from 2019-2033 indicates a significant expansion, fueled by increasing prevalence of cardiovascular diseases, rising demand for minimally invasive procedures, and technological advancements in device design and functionality. Ultrasound devices currently dominate the product segment, owing to their versatility and established clinical acceptance. However, laser Doppler and transit-time flow meters are also gaining traction, particularly in specialized applications requiring high precision. The non-invasive segment is witnessing faster growth compared to invasive procedures due to patient preference for less traumatic methods and the development of advanced non-invasive technologies. Hospitals and ambulatory surgical centers are the primary end-users, although the market is expanding into other settings like clinics and research facilities. North America and Europe currently hold a significant market share, but the Asia-Pacific region is projected to witness rapid growth due to rising healthcare expenditure and increasing awareness of cardiovascular health. Competitive dynamics are characterized by a mix of established players and emerging innovative companies constantly striving to improve device performance, affordability and portability.
Market restraints include the relatively high cost of advanced devices, the need for skilled professionals for accurate operation and interpretation, and potential regulatory hurdles for new technologies. However, continuous innovation in areas such as miniaturization, wireless connectivity, and improved image quality is mitigating these challenges. The integration of blood flow measurement devices with other diagnostic tools and the development of AI-powered diagnostic support systems present lucrative growth opportunities. Further segmentation by specific disease indications (e.g., peripheral artery disease, stroke) and the development of tailored devices could further fuel market expansion in the coming years. The growing emphasis on preventative healthcare and early disease detection also bodes well for market growth, emphasizing the importance of accurate and readily available blood flow monitoring solutions.
Blood Flow Measurement Devices Industry: A Comprehensive Market Report (2019-2033)
This insightful report provides a comprehensive analysis of the Blood Flow Measurement Devices market, offering crucial insights for stakeholders seeking to understand market dynamics, growth trajectories, and future opportunities. The study period spans from 2019 to 2033, with 2025 serving as the base and estimated year. The forecast period extends from 2025 to 2033, encompassing the historical period of 2019-2024. The report covers key segments including Ultrasound Devices, Transit-Time Flow Meters, and Laser Doppler; applications such as Invasive and Non-Invasive methods; and end-users including Hospitals, Ambulatory Surgical Centers, and others. Leading players like Perimed AB, Deltex Medical Group, and Medistim ASA are profiled, providing a granular view of this dynamic market. The global market size is projected to reach xx Million by 2033.
Blood Flow Measurement Devices Industry Market Composition & Trends
This section meticulously analyzes the competitive landscape of the blood flow measurement devices market, encompassing market concentration, innovation drivers, regulatory frameworks, substitute products, end-user profiles, and merger and acquisition (M&A) activities. The market is moderately fragmented, with no single player holding a dominant market share. However, companies like Perimed AB, Deltex Medical Group, and Medistim ASA hold significant shares. Innovation is primarily driven by advancements in ultrasound technology, miniaturization, and wireless capabilities, leading to improved accuracy, portability, and ease of use. Stringent regulatory approvals (e.g., FDA clearance for new devices) influence market entry and product development. Substitute technologies, such as optical methods, exert competitive pressure, necessitating continuous innovation.
- Market Share Distribution (2024): Perimed AB (15%), Deltex Medical Group (12%), Medistim ASA (10%), Others (63%).
- M&A Activity (2019-2024): Total deal value estimated at xx Million, with an average deal size of xx Million. Most M&A activities focused on expanding product portfolios and geographical reach.
- End-User Profile: Hospitals dominate the market, followed by ambulatory surgical centers, with other end-users (research institutions, clinics) contributing a smaller share.
Blood Flow Measurement Devices Industry Industry Evolution
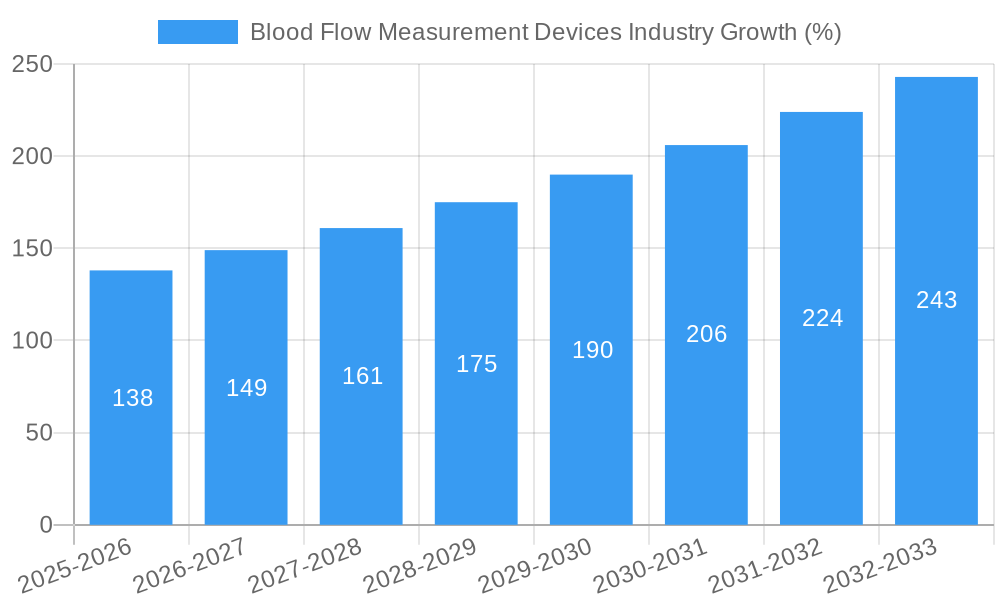
The blood flow measurement devices market has witnessed significant growth over the past decade, driven by technological advancements and increasing demand from healthcare providers. The historical period (2019-2024) showed a Compound Annual Growth Rate (CAGR) of xx%, primarily fueled by an increase in cardiovascular diseases and the rising adoption of minimally invasive surgical procedures. Technological advancements like improved sensor technology and advanced data analysis capabilities have enhanced the accuracy and efficiency of blood flow measurement. The shift towards minimally invasive procedures has further propelled the demand for non-invasive blood flow measurement devices. Consumer demand is increasingly focused on portability, ease of use, and wireless connectivity. The forecast period (2025-2033) projects a CAGR of xx%, driven by factors such as increasing prevalence of chronic diseases, technological innovations in non-invasive techniques, and expanding healthcare infrastructure. The adoption rate of advanced blood flow measurement devices is expected to increase significantly, particularly in developing countries.
Leading Regions, Countries, or Segments in Blood Flow Measurement Devices Industry
North America currently holds the largest market share, driven by high healthcare expenditure, advanced healthcare infrastructure, and a high prevalence of cardiovascular diseases. Within the product segments, Ultrasound Devices dominate due to their versatility and non-invasive nature. Invasive procedures still maintain a significant portion of the application segment, while the non-invasive segment is showing robust growth.
Key Drivers for North America Dominance:
- High healthcare expenditure and insurance coverage
- Advanced medical infrastructure and skilled professionals
- Significant investments in R&D and technological advancements
- Stringent regulatory approvals promoting market growth.
Key Drivers for Ultrasound Devices Dominance:
- Versatility in applications across various clinical settings
- Non-invasive nature, improving patient comfort and safety
- Continuous technological improvements in image quality and resolution
- Relatively lower cost compared to other technologies.
Blood Flow Measurement Devices Industry Product Innovations
Recent innovations focus on enhancing portability, improving image quality (for ultrasound devices), increasing accuracy, and simplifying user interfaces. Miniaturization of devices and integration of wireless technologies are major trends. Advanced algorithms for data processing and analysis enhance diagnostic capabilities. Unique selling propositions include real-time feedback, advanced visualization capabilities, and integration with Electronic Health Records (EHR) systems. For instance, Philips' expansion of its ultrasound portfolio with advanced hemodynamic capabilities demonstrates this trend.
Propelling Factors for Blood Flow Measurement Devices Industry Growth
Several factors fuel the growth of this market. Firstly, the increasing prevalence of cardiovascular diseases and related conditions globally drives demand for accurate and efficient diagnostic tools. Secondly, technological advancements resulting in more precise, portable, and user-friendly devices are significantly impacting market expansion. Thirdly, favorable regulatory environments and increasing healthcare spending in various regions further contribute to market growth. Finally, a growing awareness among both healthcare professionals and patients about the importance of early disease detection and effective monitoring supports this market's growth.
Obstacles in the Blood Flow Measurement Devices Industry Market
Despite the significant growth potential, several challenges impede market expansion. High device costs and limited reimbursement policies in some regions constrain accessibility. Supply chain disruptions and the complexity of regulatory approvals for new devices present further obstacles. The market faces competition from substitute technologies and ongoing technological advancements require continuous innovation to stay competitive. These factors can significantly affect the market's growth trajectory, impacting the sales and overall profitability of businesses within the sector.
Future Opportunities in Blood Flow Measurement Devices Industry
Future opportunities lie in the development of more advanced and sophisticated technologies, such as AI-powered diagnostic tools. The integration of blood flow measurement devices with other diagnostic technologies enhances comprehensive patient care. Expanding into emerging markets with growing healthcare infrastructure offers considerable growth potential. Development of point-of-care devices for remote monitoring and telemedicine applications is a promising area for future innovation. The rising demand for personalized medicine further creates opportunities for customized devices and treatment plans based on individual patient needs.
Major Players in the Blood Flow Measurement Devices Industry Ecosystem
- Perimed AB
- Deltex Medical Group
- Medistim ASA
- Compumedics
- Atys Medical
- Cook Group Incorporated
- Carolina Medical Inc
- SONOTEC GmbH
- Transonic
- ADInstruments
- ArjoHuntleigh Inc
- Moor Instruments Ltd
Key Developments in Blood Flow Measurement Devices Industry Industry
- May 2022: NuraLogix launched a 30-second contactless blood pressure and vital sign measurement technology in Singapore, signifying advancements in non-invasive monitoring.
- February 2022: Philips expanded its ultrasound portfolio with advanced hemodynamic assessment capabilities, enhancing real-time blood flow measurement. These developments showcase technological advancements that directly influence market dynamics, competition, and patient care.
Strategic Blood Flow Measurement Devices Industry Market Forecast
The blood flow measurement devices market is poised for significant growth in the coming years. Technological advancements, rising prevalence of chronic diseases, and increased healthcare expenditure will be key drivers. The focus on minimally invasive procedures and the development of advanced non-invasive techniques will further propel market expansion. Emerging markets represent significant growth opportunities. The overall market outlook is positive, with substantial potential for both established players and new entrants to contribute to innovation and market expansion.
Blood Flow Measurement Devices Industry Segmentation
-
1. Product
-
1.1. Ultrasound Devices
- 1.1.1. Ultrasound Doppler
- 1.1.2. Transit-Time Flow Meters
- 1.2. Laser Doppler
-
1.1. Ultrasound Devices
-
2. Application
-
2.1. Invasive
- 2.1.1. Microvascular Surgery
- 2.1.2. Coronary Artery Bypass Surgery
- 2.1.3. Others
-
2.2. Non-Invasive
- 2.2.1. Cardiovascular Disease
- 2.2.2. Gastroenterology
- 2.2.3. Tumor Monitoring
-
2.1. Invasive
-
3. End-User
- 3.1. Hospitals
- 3.2. Ambulatory Surgical Centers
- 3.3. Others
Blood Flow Measurement Devices Industry Segmentation By Geography
-
1. North America
- 1.1. United States
- 1.2. Canada
- 1.3. Mexico
-
2. Europe
- 2.1. Germany
- 2.2. United Kingdom
- 2.3. France
- 2.4. Italy
- 2.5. Spain
- 2.6. Rest of Europe
-
3. Asia Pacific
- 3.1. China
- 3.2. Japan
- 3.3. India
- 3.4. Australia
- 3.5. South Korea
- 3.6. Rest of Asia Pacific
-
4. Middle East and Africa
- 4.1. GCC
- 4.2. South Africa
- 4.3. Rest of Middle East and Africa
-
5. South America
- 5.1. Brazil
- 5.2. Argentina
- 5.3. Rest of South America
Blood Flow Measurement Devices Industry REPORT HIGHLIGHTS
| Aspects | Details |
|---|---|
| Study Period | 2019-2033 |
| Base Year | 2024 |
| Estimated Year | 2025 |
| Forecast Period | 2025-2033 |
| Historical Period | 2019-2024 |
| Growth Rate | CAGR of 9.20% from 2019-2033 |
| Segmentation |
|
Table of Contents
- 1. Introduction
- 1.1. Research Scope
- 1.2. Market Segmentation
- 1.3. Research Methodology
- 1.4. Definitions and Assumptions
- 2. Executive Summary
- 2.1. Introduction
- 3. Market Dynamics
- 3.1. Introduction
- 3.2. Market Drivers
- 3.2.1. Increasing Prevalence of Cardiovascular Diseases and Growing Geriatric Population; Advancements in Product Technologies
- 3.3. Market Restrains
- 3.3.1. High Cost of Blood Flow Measurement Devices; Limited Reimbursement Scenario
- 3.4. Market Trends
- 3.4.1. Ultrasound Dopplers Segment is Expected to Hold a Major Market Share in the Blood Flow Measurement Devices Market.
- 4. Market Factor Analysis
- 4.1. Porters Five Forces
- 4.2. Supply/Value Chain
- 4.3. PESTEL analysis
- 4.4. Market Entropy
- 4.5. Patent/Trademark Analysis
- 5. Global Blood Flow Measurement Devices Industry Analysis, Insights and Forecast, 2019-2031
- 5.1. Market Analysis, Insights and Forecast - by Product
- 5.1.1. Ultrasound Devices
- 5.1.1.1. Ultrasound Doppler
- 5.1.1.2. Transit-Time Flow Meters
- 5.1.2. Laser Doppler
- 5.1.1. Ultrasound Devices
- 5.2. Market Analysis, Insights and Forecast - by Application
- 5.2.1. Invasive
- 5.2.1.1. Microvascular Surgery
- 5.2.1.2. Coronary Artery Bypass Surgery
- 5.2.1.3. Others
- 5.2.2. Non-Invasive
- 5.2.2.1. Cardiovascular Disease
- 5.2.2.2. Gastroenterology
- 5.2.2.3. Tumor Monitoring
- 5.2.1. Invasive
- 5.3. Market Analysis, Insights and Forecast - by End-User
- 5.3.1. Hospitals
- 5.3.2. Ambulatory Surgical Centers
- 5.3.3. Others
- 5.4. Market Analysis, Insights and Forecast - by Region
- 5.4.1. North America
- 5.4.2. Europe
- 5.4.3. Asia Pacific
- 5.4.4. Middle East and Africa
- 5.4.5. South America
- 5.1. Market Analysis, Insights and Forecast - by Product
- 6. North America Blood Flow Measurement Devices Industry Analysis, Insights and Forecast, 2019-2031
- 6.1. Market Analysis, Insights and Forecast - by Product
- 6.1.1. Ultrasound Devices
- 6.1.1.1. Ultrasound Doppler
- 6.1.1.2. Transit-Time Flow Meters
- 6.1.2. Laser Doppler
- 6.1.1. Ultrasound Devices
- 6.2. Market Analysis, Insights and Forecast - by Application
- 6.2.1. Invasive
- 6.2.1.1. Microvascular Surgery
- 6.2.1.2. Coronary Artery Bypass Surgery
- 6.2.1.3. Others
- 6.2.2. Non-Invasive
- 6.2.2.1. Cardiovascular Disease
- 6.2.2.2. Gastroenterology
- 6.2.2.3. Tumor Monitoring
- 6.2.1. Invasive
- 6.3. Market Analysis, Insights and Forecast - by End-User
- 6.3.1. Hospitals
- 6.3.2. Ambulatory Surgical Centers
- 6.3.3. Others
- 6.1. Market Analysis, Insights and Forecast - by Product
- 7. Europe Blood Flow Measurement Devices Industry Analysis, Insights and Forecast, 2019-2031
- 7.1. Market Analysis, Insights and Forecast - by Product
- 7.1.1. Ultrasound Devices
- 7.1.1.1. Ultrasound Doppler
- 7.1.1.2. Transit-Time Flow Meters
- 7.1.2. Laser Doppler
- 7.1.1. Ultrasound Devices
- 7.2. Market Analysis, Insights and Forecast - by Application
- 7.2.1. Invasive
- 7.2.1.1. Microvascular Surgery
- 7.2.1.2. Coronary Artery Bypass Surgery
- 7.2.1.3. Others
- 7.2.2. Non-Invasive
- 7.2.2.1. Cardiovascular Disease
- 7.2.2.2. Gastroenterology
- 7.2.2.3. Tumor Monitoring
- 7.2.1. Invasive
- 7.3. Market Analysis, Insights and Forecast - by End-User
- 7.3.1. Hospitals
- 7.3.2. Ambulatory Surgical Centers
- 7.3.3. Others
- 7.1. Market Analysis, Insights and Forecast - by Product
- 8. Asia Pacific Blood Flow Measurement Devices Industry Analysis, Insights and Forecast, 2019-2031
- 8.1. Market Analysis, Insights and Forecast - by Product
- 8.1.1. Ultrasound Devices
- 8.1.1.1. Ultrasound Doppler
- 8.1.1.2. Transit-Time Flow Meters
- 8.1.2. Laser Doppler
- 8.1.1. Ultrasound Devices
- 8.2. Market Analysis, Insights and Forecast - by Application
- 8.2.1. Invasive
- 8.2.1.1. Microvascular Surgery
- 8.2.1.2. Coronary Artery Bypass Surgery
- 8.2.1.3. Others
- 8.2.2. Non-Invasive
- 8.2.2.1. Cardiovascular Disease
- 8.2.2.2. Gastroenterology
- 8.2.2.3. Tumor Monitoring
- 8.2.1. Invasive
- 8.3. Market Analysis, Insights and Forecast - by End-User
- 8.3.1. Hospitals
- 8.3.2. Ambulatory Surgical Centers
- 8.3.3. Others
- 8.1. Market Analysis, Insights and Forecast - by Product
- 9. Middle East and Africa Blood Flow Measurement Devices Industry Analysis, Insights and Forecast, 2019-2031
- 9.1. Market Analysis, Insights and Forecast - by Product
- 9.1.1. Ultrasound Devices
- 9.1.1.1. Ultrasound Doppler
- 9.1.1.2. Transit-Time Flow Meters
- 9.1.2. Laser Doppler
- 9.1.1. Ultrasound Devices
- 9.2. Market Analysis, Insights and Forecast - by Application
- 9.2.1. Invasive
- 9.2.1.1. Microvascular Surgery
- 9.2.1.2. Coronary Artery Bypass Surgery
- 9.2.1.3. Others
- 9.2.2. Non-Invasive
- 9.2.2.1. Cardiovascular Disease
- 9.2.2.2. Gastroenterology
- 9.2.2.3. Tumor Monitoring
- 9.2.1. Invasive
- 9.3. Market Analysis, Insights and Forecast - by End-User
- 9.3.1. Hospitals
- 9.3.2. Ambulatory Surgical Centers
- 9.3.3. Others
- 9.1. Market Analysis, Insights and Forecast - by Product
- 10. South America Blood Flow Measurement Devices Industry Analysis, Insights and Forecast, 2019-2031
- 10.1. Market Analysis, Insights and Forecast - by Product
- 10.1.1. Ultrasound Devices
- 10.1.1.1. Ultrasound Doppler
- 10.1.1.2. Transit-Time Flow Meters
- 10.1.2. Laser Doppler
- 10.1.1. Ultrasound Devices
- 10.2. Market Analysis, Insights and Forecast - by Application
- 10.2.1. Invasive
- 10.2.1.1. Microvascular Surgery
- 10.2.1.2. Coronary Artery Bypass Surgery
- 10.2.1.3. Others
- 10.2.2. Non-Invasive
- 10.2.2.1. Cardiovascular Disease
- 10.2.2.2. Gastroenterology
- 10.2.2.3. Tumor Monitoring
- 10.2.1. Invasive
- 10.3. Market Analysis, Insights and Forecast - by End-User
- 10.3.1. Hospitals
- 10.3.2. Ambulatory Surgical Centers
- 10.3.3. Others
- 10.1. Market Analysis, Insights and Forecast - by Product
- 11. North America Blood Flow Measurement Devices Industry Analysis, Insights and Forecast, 2019-2031
- 11.1. Market Analysis, Insights and Forecast - By Country/Sub-region
- 11.1.1. undefined
- 12. Europe Blood Flow Measurement Devices Industry Analysis, Insights and Forecast, 2019-2031
- 12.1. Market Analysis, Insights and Forecast - By Country/Sub-region
- 12.1.1. undefined
- 13. Asia Pacific Blood Flow Measurement Devices Industry Analysis, Insights and Forecast, 2019-2031
- 13.1. Market Analysis, Insights and Forecast - By Country/Sub-region
- 13.1.1. undefined
- 14. Middle East and Africa Blood Flow Measurement Devices Industry Analysis, Insights and Forecast, 2019-2031
- 14.1. Market Analysis, Insights and Forecast - By Country/Sub-region
- 14.1.1. undefined
- 15. South America Blood Flow Measurement Devices Industry Analysis, Insights and Forecast, 2019-2031
- 15.1. Market Analysis, Insights and Forecast - By Country/Sub-region
- 15.1.1. undefined
- 16. Competitive Analysis
- 16.1. Global Market Share Analysis 2024
- 16.2. Company Profiles
- 16.2.1 Perimed AB
- 16.2.1.1. Overview
- 16.2.1.2. Products
- 16.2.1.3. SWOT Analysis
- 16.2.1.4. Recent Developments
- 16.2.1.5. Financials (Based on Availability)
- 16.2.2 Deltex Medical Group
- 16.2.2.1. Overview
- 16.2.2.2. Products
- 16.2.2.3. SWOT Analysis
- 16.2.2.4. Recent Developments
- 16.2.2.5. Financials (Based on Availability)
- 16.2.3 Medistim ASA
- 16.2.3.1. Overview
- 16.2.3.2. Products
- 16.2.3.3. SWOT Analysis
- 16.2.3.4. Recent Developments
- 16.2.3.5. Financials (Based on Availability)
- 16.2.4 Compumedics
- 16.2.4.1. Overview
- 16.2.4.2. Products
- 16.2.4.3. SWOT Analysis
- 16.2.4.4. Recent Developments
- 16.2.4.5. Financials (Based on Availability)
- 16.2.5 Atys Medical
- 16.2.5.1. Overview
- 16.2.5.2. Products
- 16.2.5.3. SWOT Analysis
- 16.2.5.4. Recent Developments
- 16.2.5.5. Financials (Based on Availability)
- 16.2.6 Cook Group Incorporated
- 16.2.6.1. Overview
- 16.2.6.2. Products
- 16.2.6.3. SWOT Analysis
- 16.2.6.4. Recent Developments
- 16.2.6.5. Financials (Based on Availability)
- 16.2.7 Carolina Medical Inc
- 16.2.7.1. Overview
- 16.2.7.2. Products
- 16.2.7.3. SWOT Analysis
- 16.2.7.4. Recent Developments
- 16.2.7.5. Financials (Based on Availability)
- 16.2.8 SONOTEC GmbH
- 16.2.8.1. Overview
- 16.2.8.2. Products
- 16.2.8.3. SWOT Analysis
- 16.2.8.4. Recent Developments
- 16.2.8.5. Financials (Based on Availability)
- 16.2.9 Transonic
- 16.2.9.1. Overview
- 16.2.9.2. Products
- 16.2.9.3. SWOT Analysis
- 16.2.9.4. Recent Developments
- 16.2.9.5. Financials (Based on Availability)
- 16.2.10 ADInstruments
- 16.2.10.1. Overview
- 16.2.10.2. Products
- 16.2.10.3. SWOT Analysis
- 16.2.10.4. Recent Developments
- 16.2.10.5. Financials (Based on Availability)
- 16.2.11 ArjoHuntleigh Inc
- 16.2.11.1. Overview
- 16.2.11.2. Products
- 16.2.11.3. SWOT Analysis
- 16.2.11.4. Recent Developments
- 16.2.11.5. Financials (Based on Availability)
- 16.2.12 Moor Instruments Ltd
- 16.2.12.1. Overview
- 16.2.12.2. Products
- 16.2.12.3. SWOT Analysis
- 16.2.12.4. Recent Developments
- 16.2.12.5. Financials (Based on Availability)
- 16.2.1 Perimed AB
List of Figures
- Figure 1: Global Blood Flow Measurement Devices Industry Revenue Breakdown (Million, %) by Region 2024 & 2032
- Figure 2: Global Blood Flow Measurement Devices Industry Volume Breakdown (K Unit, %) by Region 2024 & 2032
- Figure 3: North America Blood Flow Measurement Devices Industry Revenue (Million), by Country 2024 & 2032
- Figure 4: North America Blood Flow Measurement Devices Industry Volume (K Unit), by Country 2024 & 2032
- Figure 5: North America Blood Flow Measurement Devices Industry Revenue Share (%), by Country 2024 & 2032
- Figure 6: North America Blood Flow Measurement Devices Industry Volume Share (%), by Country 2024 & 2032
- Figure 7: Europe Blood Flow Measurement Devices Industry Revenue (Million), by Country 2024 & 2032
- Figure 8: Europe Blood Flow Measurement Devices Industry Volume (K Unit), by Country 2024 & 2032
- Figure 9: Europe Blood Flow Measurement Devices Industry Revenue Share (%), by Country 2024 & 2032
- Figure 10: Europe Blood Flow Measurement Devices Industry Volume Share (%), by Country 2024 & 2032
- Figure 11: Asia Pacific Blood Flow Measurement Devices Industry Revenue (Million), by Country 2024 & 2032
- Figure 12: Asia Pacific Blood Flow Measurement Devices Industry Volume (K Unit), by Country 2024 & 2032
- Figure 13: Asia Pacific Blood Flow Measurement Devices Industry Revenue Share (%), by Country 2024 & 2032
- Figure 14: Asia Pacific Blood Flow Measurement Devices Industry Volume Share (%), by Country 2024 & 2032
- Figure 15: Middle East and Africa Blood Flow Measurement Devices Industry Revenue (Million), by Country 2024 & 2032
- Figure 16: Middle East and Africa Blood Flow Measurement Devices Industry Volume (K Unit), by Country 2024 & 2032
- Figure 17: Middle East and Africa Blood Flow Measurement Devices Industry Revenue Share (%), by Country 2024 & 2032
- Figure 18: Middle East and Africa Blood Flow Measurement Devices Industry Volume Share (%), by Country 2024 & 2032
- Figure 19: South America Blood Flow Measurement Devices Industry Revenue (Million), by Country 2024 & 2032
- Figure 20: South America Blood Flow Measurement Devices Industry Volume (K Unit), by Country 2024 & 2032
- Figure 21: South America Blood Flow Measurement Devices Industry Revenue Share (%), by Country 2024 & 2032
- Figure 22: South America Blood Flow Measurement Devices Industry Volume Share (%), by Country 2024 & 2032
- Figure 23: North America Blood Flow Measurement Devices Industry Revenue (Million), by Product 2024 & 2032
- Figure 24: North America Blood Flow Measurement Devices Industry Volume (K Unit), by Product 2024 & 2032
- Figure 25: North America Blood Flow Measurement Devices Industry Revenue Share (%), by Product 2024 & 2032
- Figure 26: North America Blood Flow Measurement Devices Industry Volume Share (%), by Product 2024 & 2032
- Figure 27: North America Blood Flow Measurement Devices Industry Revenue (Million), by Application 2024 & 2032
- Figure 28: North America Blood Flow Measurement Devices Industry Volume (K Unit), by Application 2024 & 2032
- Figure 29: North America Blood Flow Measurement Devices Industry Revenue Share (%), by Application 2024 & 2032
- Figure 30: North America Blood Flow Measurement Devices Industry Volume Share (%), by Application 2024 & 2032
- Figure 31: North America Blood Flow Measurement Devices Industry Revenue (Million), by End-User 2024 & 2032
- Figure 32: North America Blood Flow Measurement Devices Industry Volume (K Unit), by End-User 2024 & 2032
- Figure 33: North America Blood Flow Measurement Devices Industry Revenue Share (%), by End-User 2024 & 2032
- Figure 34: North America Blood Flow Measurement Devices Industry Volume Share (%), by End-User 2024 & 2032
- Figure 35: North America Blood Flow Measurement Devices Industry Revenue (Million), by Country 2024 & 2032
- Figure 36: North America Blood Flow Measurement Devices Industry Volume (K Unit), by Country 2024 & 2032
- Figure 37: North America Blood Flow Measurement Devices Industry Revenue Share (%), by Country 2024 & 2032
- Figure 38: North America Blood Flow Measurement Devices Industry Volume Share (%), by Country 2024 & 2032
- Figure 39: Europe Blood Flow Measurement Devices Industry Revenue (Million), by Product 2024 & 2032
- Figure 40: Europe Blood Flow Measurement Devices Industry Volume (K Unit), by Product 2024 & 2032
- Figure 41: Europe Blood Flow Measurement Devices Industry Revenue Share (%), by Product 2024 & 2032
- Figure 42: Europe Blood Flow Measurement Devices Industry Volume Share (%), by Product 2024 & 2032
- Figure 43: Europe Blood Flow Measurement Devices Industry Revenue (Million), by Application 2024 & 2032
- Figure 44: Europe Blood Flow Measurement Devices Industry Volume (K Unit), by Application 2024 & 2032
- Figure 45: Europe Blood Flow Measurement Devices Industry Revenue Share (%), by Application 2024 & 2032
- Figure 46: Europe Blood Flow Measurement Devices Industry Volume Share (%), by Application 2024 & 2032
- Figure 47: Europe Blood Flow Measurement Devices Industry Revenue (Million), by End-User 2024 & 2032
- Figure 48: Europe Blood Flow Measurement Devices Industry Volume (K Unit), by End-User 2024 & 2032
- Figure 49: Europe Blood Flow Measurement Devices Industry Revenue Share (%), by End-User 2024 & 2032
- Figure 50: Europe Blood Flow Measurement Devices Industry Volume Share (%), by End-User 2024 & 2032
- Figure 51: Europe Blood Flow Measurement Devices Industry Revenue (Million), by Country 2024 & 2032
- Figure 52: Europe Blood Flow Measurement Devices Industry Volume (K Unit), by Country 2024 & 2032
- Figure 53: Europe Blood Flow Measurement Devices Industry Revenue Share (%), by Country 2024 & 2032
- Figure 54: Europe Blood Flow Measurement Devices Industry Volume Share (%), by Country 2024 & 2032
- Figure 55: Asia Pacific Blood Flow Measurement Devices Industry Revenue (Million), by Product 2024 & 2032
- Figure 56: Asia Pacific Blood Flow Measurement Devices Industry Volume (K Unit), by Product 2024 & 2032
- Figure 57: Asia Pacific Blood Flow Measurement Devices Industry Revenue Share (%), by Product 2024 & 2032
- Figure 58: Asia Pacific Blood Flow Measurement Devices Industry Volume Share (%), by Product 2024 & 2032
- Figure 59: Asia Pacific Blood Flow Measurement Devices Industry Revenue (Million), by Application 2024 & 2032
- Figure 60: Asia Pacific Blood Flow Measurement Devices Industry Volume (K Unit), by Application 2024 & 2032
- Figure 61: Asia Pacific Blood Flow Measurement Devices Industry Revenue Share (%), by Application 2024 & 2032
- Figure 62: Asia Pacific Blood Flow Measurement Devices Industry Volume Share (%), by Application 2024 & 2032
- Figure 63: Asia Pacific Blood Flow Measurement Devices Industry Revenue (Million), by End-User 2024 & 2032
- Figure 64: Asia Pacific Blood Flow Measurement Devices Industry Volume (K Unit), by End-User 2024 & 2032
- Figure 65: Asia Pacific Blood Flow Measurement Devices Industry Revenue Share (%), by End-User 2024 & 2032
- Figure 66: Asia Pacific Blood Flow Measurement Devices Industry Volume Share (%), by End-User 2024 & 2032
- Figure 67: Asia Pacific Blood Flow Measurement Devices Industry Revenue (Million), by Country 2024 & 2032
- Figure 68: Asia Pacific Blood Flow Measurement Devices Industry Volume (K Unit), by Country 2024 & 2032
- Figure 69: Asia Pacific Blood Flow Measurement Devices Industry Revenue Share (%), by Country 2024 & 2032
- Figure 70: Asia Pacific Blood Flow Measurement Devices Industry Volume Share (%), by Country 2024 & 2032
- Figure 71: Middle East and Africa Blood Flow Measurement Devices Industry Revenue (Million), by Product 2024 & 2032
- Figure 72: Middle East and Africa Blood Flow Measurement Devices Industry Volume (K Unit), by Product 2024 & 2032
- Figure 73: Middle East and Africa Blood Flow Measurement Devices Industry Revenue Share (%), by Product 2024 & 2032
- Figure 74: Middle East and Africa Blood Flow Measurement Devices Industry Volume Share (%), by Product 2024 & 2032
- Figure 75: Middle East and Africa Blood Flow Measurement Devices Industry Revenue (Million), by Application 2024 & 2032
- Figure 76: Middle East and Africa Blood Flow Measurement Devices Industry Volume (K Unit), by Application 2024 & 2032
- Figure 77: Middle East and Africa Blood Flow Measurement Devices Industry Revenue Share (%), by Application 2024 & 2032
- Figure 78: Middle East and Africa Blood Flow Measurement Devices Industry Volume Share (%), by Application 2024 & 2032
- Figure 79: Middle East and Africa Blood Flow Measurement Devices Industry Revenue (Million), by End-User 2024 & 2032
- Figure 80: Middle East and Africa Blood Flow Measurement Devices Industry Volume (K Unit), by End-User 2024 & 2032
- Figure 81: Middle East and Africa Blood Flow Measurement Devices Industry Revenue Share (%), by End-User 2024 & 2032
- Figure 82: Middle East and Africa Blood Flow Measurement Devices Industry Volume Share (%), by End-User 2024 & 2032
- Figure 83: Middle East and Africa Blood Flow Measurement Devices Industry Revenue (Million), by Country 2024 & 2032
- Figure 84: Middle East and Africa Blood Flow Measurement Devices Industry Volume (K Unit), by Country 2024 & 2032
- Figure 85: Middle East and Africa Blood Flow Measurement Devices Industry Revenue Share (%), by Country 2024 & 2032
- Figure 86: Middle East and Africa Blood Flow Measurement Devices Industry Volume Share (%), by Country 2024 & 2032
- Figure 87: South America Blood Flow Measurement Devices Industry Revenue (Million), by Product 2024 & 2032
- Figure 88: South America Blood Flow Measurement Devices Industry Volume (K Unit), by Product 2024 & 2032
- Figure 89: South America Blood Flow Measurement Devices Industry Revenue Share (%), by Product 2024 & 2032
- Figure 90: South America Blood Flow Measurement Devices Industry Volume Share (%), by Product 2024 & 2032
- Figure 91: South America Blood Flow Measurement Devices Industry Revenue (Million), by Application 2024 & 2032
- Figure 92: South America Blood Flow Measurement Devices Industry Volume (K Unit), by Application 2024 & 2032
- Figure 93: South America Blood Flow Measurement Devices Industry Revenue Share (%), by Application 2024 & 2032
- Figure 94: South America Blood Flow Measurement Devices Industry Volume Share (%), by Application 2024 & 2032
- Figure 95: South America Blood Flow Measurement Devices Industry Revenue (Million), by End-User 2024 & 2032
- Figure 96: South America Blood Flow Measurement Devices Industry Volume (K Unit), by End-User 2024 & 2032
- Figure 97: South America Blood Flow Measurement Devices Industry Revenue Share (%), by End-User 2024 & 2032
- Figure 98: South America Blood Flow Measurement Devices Industry Volume Share (%), by End-User 2024 & 2032
- Figure 99: South America Blood Flow Measurement Devices Industry Revenue (Million), by Country 2024 & 2032
- Figure 100: South America Blood Flow Measurement Devices Industry Volume (K Unit), by Country 2024 & 2032
- Figure 101: South America Blood Flow Measurement Devices Industry Revenue Share (%), by Country 2024 & 2032
- Figure 102: South America Blood Flow Measurement Devices Industry Volume Share (%), by Country 2024 & 2032
List of Tables
- Table 1: Global Blood Flow Measurement Devices Industry Revenue Million Forecast, by Region 2019 & 2032
- Table 2: Global Blood Flow Measurement Devices Industry Volume K Unit Forecast, by Region 2019 & 2032
- Table 3: Global Blood Flow Measurement Devices Industry Revenue Million Forecast, by Product 2019 & 2032
- Table 4: Global Blood Flow Measurement Devices Industry Volume K Unit Forecast, by Product 2019 & 2032
- Table 5: Global Blood Flow Measurement Devices Industry Revenue Million Forecast, by Application 2019 & 2032
- Table 6: Global Blood Flow Measurement Devices Industry Volume K Unit Forecast, by Application 2019 & 2032
- Table 7: Global Blood Flow Measurement Devices Industry Revenue Million Forecast, by End-User 2019 & 2032
- Table 8: Global Blood Flow Measurement Devices Industry Volume K Unit Forecast, by End-User 2019 & 2032
- Table 9: Global Blood Flow Measurement Devices Industry Revenue Million Forecast, by Region 2019 & 2032
- Table 10: Global Blood Flow Measurement Devices Industry Volume K Unit Forecast, by Region 2019 & 2032
- Table 11: Global Blood Flow Measurement Devices Industry Revenue Million Forecast, by Country 2019 & 2032
- Table 12: Global Blood Flow Measurement Devices Industry Volume K Unit Forecast, by Country 2019 & 2032
- Table 13: Global Blood Flow Measurement Devices Industry Revenue Million Forecast, by Country 2019 & 2032
- Table 14: Global Blood Flow Measurement Devices Industry Volume K Unit Forecast, by Country 2019 & 2032
- Table 15: Global Blood Flow Measurement Devices Industry Revenue Million Forecast, by Country 2019 & 2032
- Table 16: Global Blood Flow Measurement Devices Industry Volume K Unit Forecast, by Country 2019 & 2032
- Table 17: Global Blood Flow Measurement Devices Industry Revenue Million Forecast, by Country 2019 & 2032
- Table 18: Global Blood Flow Measurement Devices Industry Volume K Unit Forecast, by Country 2019 & 2032
- Table 19: Global Blood Flow Measurement Devices Industry Revenue Million Forecast, by Country 2019 & 2032
- Table 20: Global Blood Flow Measurement Devices Industry Volume K Unit Forecast, by Country 2019 & 2032
- Table 21: Global Blood Flow Measurement Devices Industry Revenue Million Forecast, by Product 2019 & 2032
- Table 22: Global Blood Flow Measurement Devices Industry Volume K Unit Forecast, by Product 2019 & 2032
- Table 23: Global Blood Flow Measurement Devices Industry Revenue Million Forecast, by Application 2019 & 2032
- Table 24: Global Blood Flow Measurement Devices Industry Volume K Unit Forecast, by Application 2019 & 2032
- Table 25: Global Blood Flow Measurement Devices Industry Revenue Million Forecast, by End-User 2019 & 2032
- Table 26: Global Blood Flow Measurement Devices Industry Volume K Unit Forecast, by End-User 2019 & 2032
- Table 27: Global Blood Flow Measurement Devices Industry Revenue Million Forecast, by Country 2019 & 2032
- Table 28: Global Blood Flow Measurement Devices Industry Volume K Unit Forecast, by Country 2019 & 2032
- Table 29: United States Blood Flow Measurement Devices Industry Revenue (Million) Forecast, by Application 2019 & 2032
- Table 30: United States Blood Flow Measurement Devices Industry Volume (K Unit) Forecast, by Application 2019 & 2032
- Table 31: Canada Blood Flow Measurement Devices Industry Revenue (Million) Forecast, by Application 2019 & 2032
- Table 32: Canada Blood Flow Measurement Devices Industry Volume (K Unit) Forecast, by Application 2019 & 2032
- Table 33: Mexico Blood Flow Measurement Devices Industry Revenue (Million) Forecast, by Application 2019 & 2032
- Table 34: Mexico Blood Flow Measurement Devices Industry Volume (K Unit) Forecast, by Application 2019 & 2032
- Table 35: Global Blood Flow Measurement Devices Industry Revenue Million Forecast, by Product 2019 & 2032
- Table 36: Global Blood Flow Measurement Devices Industry Volume K Unit Forecast, by Product 2019 & 2032
- Table 37: Global Blood Flow Measurement Devices Industry Revenue Million Forecast, by Application 2019 & 2032
- Table 38: Global Blood Flow Measurement Devices Industry Volume K Unit Forecast, by Application 2019 & 2032
- Table 39: Global Blood Flow Measurement Devices Industry Revenue Million Forecast, by End-User 2019 & 2032
- Table 40: Global Blood Flow Measurement Devices Industry Volume K Unit Forecast, by End-User 2019 & 2032
- Table 41: Global Blood Flow Measurement Devices Industry Revenue Million Forecast, by Country 2019 & 2032
- Table 42: Global Blood Flow Measurement Devices Industry Volume K Unit Forecast, by Country 2019 & 2032
- Table 43: Germany Blood Flow Measurement Devices Industry Revenue (Million) Forecast, by Application 2019 & 2032
- Table 44: Germany Blood Flow Measurement Devices Industry Volume (K Unit) Forecast, by Application 2019 & 2032
- Table 45: United Kingdom Blood Flow Measurement Devices Industry Revenue (Million) Forecast, by Application 2019 & 2032
- Table 46: United Kingdom Blood Flow Measurement Devices Industry Volume (K Unit) Forecast, by Application 2019 & 2032
- Table 47: France Blood Flow Measurement Devices Industry Revenue (Million) Forecast, by Application 2019 & 2032
- Table 48: France Blood Flow Measurement Devices Industry Volume (K Unit) Forecast, by Application 2019 & 2032
- Table 49: Italy Blood Flow Measurement Devices Industry Revenue (Million) Forecast, by Application 2019 & 2032
- Table 50: Italy Blood Flow Measurement Devices Industry Volume (K Unit) Forecast, by Application 2019 & 2032
- Table 51: Spain Blood Flow Measurement Devices Industry Revenue (Million) Forecast, by Application 2019 & 2032
- Table 52: Spain Blood Flow Measurement Devices Industry Volume (K Unit) Forecast, by Application 2019 & 2032
- Table 53: Rest of Europe Blood Flow Measurement Devices Industry Revenue (Million) Forecast, by Application 2019 & 2032
- Table 54: Rest of Europe Blood Flow Measurement Devices Industry Volume (K Unit) Forecast, by Application 2019 & 2032
- Table 55: Global Blood Flow Measurement Devices Industry Revenue Million Forecast, by Product 2019 & 2032
- Table 56: Global Blood Flow Measurement Devices Industry Volume K Unit Forecast, by Product 2019 & 2032
- Table 57: Global Blood Flow Measurement Devices Industry Revenue Million Forecast, by Application 2019 & 2032
- Table 58: Global Blood Flow Measurement Devices Industry Volume K Unit Forecast, by Application 2019 & 2032
- Table 59: Global Blood Flow Measurement Devices Industry Revenue Million Forecast, by End-User 2019 & 2032
- Table 60: Global Blood Flow Measurement Devices Industry Volume K Unit Forecast, by End-User 2019 & 2032
- Table 61: Global Blood Flow Measurement Devices Industry Revenue Million Forecast, by Country 2019 & 2032
- Table 62: Global Blood Flow Measurement Devices Industry Volume K Unit Forecast, by Country 2019 & 2032
- Table 63: China Blood Flow Measurement Devices Industry Revenue (Million) Forecast, by Application 2019 & 2032
- Table 64: China Blood Flow Measurement Devices Industry Volume (K Unit) Forecast, by Application 2019 & 2032
- Table 65: Japan Blood Flow Measurement Devices Industry Revenue (Million) Forecast, by Application 2019 & 2032
- Table 66: Japan Blood Flow Measurement Devices Industry Volume (K Unit) Forecast, by Application 2019 & 2032
- Table 67: India Blood Flow Measurement Devices Industry Revenue (Million) Forecast, by Application 2019 & 2032
- Table 68: India Blood Flow Measurement Devices Industry Volume (K Unit) Forecast, by Application 2019 & 2032
- Table 69: Australia Blood Flow Measurement Devices Industry Revenue (Million) Forecast, by Application 2019 & 2032
- Table 70: Australia Blood Flow Measurement Devices Industry Volume (K Unit) Forecast, by Application 2019 & 2032
- Table 71: South Korea Blood Flow Measurement Devices Industry Revenue (Million) Forecast, by Application 2019 & 2032
- Table 72: South Korea Blood Flow Measurement Devices Industry Volume (K Unit) Forecast, by Application 2019 & 2032
- Table 73: Rest of Asia Pacific Blood Flow Measurement Devices Industry Revenue (Million) Forecast, by Application 2019 & 2032
- Table 74: Rest of Asia Pacific Blood Flow Measurement Devices Industry Volume (K Unit) Forecast, by Application 2019 & 2032
- Table 75: Global Blood Flow Measurement Devices Industry Revenue Million Forecast, by Product 2019 & 2032
- Table 76: Global Blood Flow Measurement Devices Industry Volume K Unit Forecast, by Product 2019 & 2032
- Table 77: Global Blood Flow Measurement Devices Industry Revenue Million Forecast, by Application 2019 & 2032
- Table 78: Global Blood Flow Measurement Devices Industry Volume K Unit Forecast, by Application 2019 & 2032
- Table 79: Global Blood Flow Measurement Devices Industry Revenue Million Forecast, by End-User 2019 & 2032
- Table 80: Global Blood Flow Measurement Devices Industry Volume K Unit Forecast, by End-User 2019 & 2032
- Table 81: Global Blood Flow Measurement Devices Industry Revenue Million Forecast, by Country 2019 & 2032
- Table 82: Global Blood Flow Measurement Devices Industry Volume K Unit Forecast, by Country 2019 & 2032
- Table 83: GCC Blood Flow Measurement Devices Industry Revenue (Million) Forecast, by Application 2019 & 2032
- Table 84: GCC Blood Flow Measurement Devices Industry Volume (K Unit) Forecast, by Application 2019 & 2032
- Table 85: South Africa Blood Flow Measurement Devices Industry Revenue (Million) Forecast, by Application 2019 & 2032
- Table 86: South Africa Blood Flow Measurement Devices Industry Volume (K Unit) Forecast, by Application 2019 & 2032
- Table 87: Rest of Middle East and Africa Blood Flow Measurement Devices Industry Revenue (Million) Forecast, by Application 2019 & 2032
- Table 88: Rest of Middle East and Africa Blood Flow Measurement Devices Industry Volume (K Unit) Forecast, by Application 2019 & 2032
- Table 89: Global Blood Flow Measurement Devices Industry Revenue Million Forecast, by Product 2019 & 2032
- Table 90: Global Blood Flow Measurement Devices Industry Volume K Unit Forecast, by Product 2019 & 2032
- Table 91: Global Blood Flow Measurement Devices Industry Revenue Million Forecast, by Application 2019 & 2032
- Table 92: Global Blood Flow Measurement Devices Industry Volume K Unit Forecast, by Application 2019 & 2032
- Table 93: Global Blood Flow Measurement Devices Industry Revenue Million Forecast, by End-User 2019 & 2032
- Table 94: Global Blood Flow Measurement Devices Industry Volume K Unit Forecast, by End-User 2019 & 2032
- Table 95: Global Blood Flow Measurement Devices Industry Revenue Million Forecast, by Country 2019 & 2032
- Table 96: Global Blood Flow Measurement Devices Industry Volume K Unit Forecast, by Country 2019 & 2032
- Table 97: Brazil Blood Flow Measurement Devices Industry Revenue (Million) Forecast, by Application 2019 & 2032
- Table 98: Brazil Blood Flow Measurement Devices Industry Volume (K Unit) Forecast, by Application 2019 & 2032
- Table 99: Argentina Blood Flow Measurement Devices Industry Revenue (Million) Forecast, by Application 2019 & 2032
- Table 100: Argentina Blood Flow Measurement Devices Industry Volume (K Unit) Forecast, by Application 2019 & 2032
- Table 101: Rest of South America Blood Flow Measurement Devices Industry Revenue (Million) Forecast, by Application 2019 & 2032
- Table 102: Rest of South America Blood Flow Measurement Devices Industry Volume (K Unit) Forecast, by Application 2019 & 2032
Frequently Asked Questions
1. What is the projected Compound Annual Growth Rate (CAGR) of the Blood Flow Measurement Devices Industry?
The projected CAGR is approximately 9.20%.
2. Which companies are prominent players in the Blood Flow Measurement Devices Industry?
Key companies in the market include Perimed AB, Deltex Medical Group, Medistim ASA, Compumedics, Atys Medical, Cook Group Incorporated, Carolina Medical Inc, SONOTEC GmbH, Transonic, ADInstruments, ArjoHuntleigh Inc, Moor Instruments Ltd.
3. What are the main segments of the Blood Flow Measurement Devices Industry?
The market segments include Product, Application, End-User.
4. Can you provide details about the market size?
The market size is estimated to be USD XX Million as of 2022.
5. What are some drivers contributing to market growth?
Increasing Prevalence of Cardiovascular Diseases and Growing Geriatric Population; Advancements in Product Technologies.
6. What are the notable trends driving market growth?
Ultrasound Dopplers Segment is Expected to Hold a Major Market Share in the Blood Flow Measurement Devices Market..
7. Are there any restraints impacting market growth?
High Cost of Blood Flow Measurement Devices; Limited Reimbursement Scenario.
8. Can you provide examples of recent developments in the market?
In May 2022, HealthTech AI company NuraLogix launched their 30-second contactless blood pressure and vital sign measurement technology in Singapore.
9. What pricing options are available for accessing the report?
Pricing options include single-user, multi-user, and enterprise licenses priced at USD 4750, USD 5250, and USD 8750 respectively.
10. Is the market size provided in terms of value or volume?
The market size is provided in terms of value, measured in Million and volume, measured in K Unit.
11. Are there any specific market keywords associated with the report?
Yes, the market keyword associated with the report is "Blood Flow Measurement Devices Industry," which aids in identifying and referencing the specific market segment covered.
12. How do I determine which pricing option suits my needs best?
The pricing options vary based on user requirements and access needs. Individual users may opt for single-user licenses, while businesses requiring broader access may choose multi-user or enterprise licenses for cost-effective access to the report.
13. Are there any additional resources or data provided in the Blood Flow Measurement Devices Industry report?
While the report offers comprehensive insights, it's advisable to review the specific contents or supplementary materials provided to ascertain if additional resources or data are available.
14. How can I stay updated on further developments or reports in the Blood Flow Measurement Devices Industry?
To stay informed about further developments, trends, and reports in the Blood Flow Measurement Devices Industry, consider subscribing to industry newsletters, following relevant companies and organizations, or regularly checking reputable industry news sources and publications.
Methodology
Step 1 - Identification of Relevant Samples Size from Population Database


Step 2 - Approaches for Defining Global Market Size (Value, Volume* & Price*)

Note*: In applicable scenarios
Step 3 - Data Sources
Primary Research
- Web Analytics
- Survey Reports
- Research Institute
- Latest Research Reports
- Opinion Leaders
Secondary Research
- Annual Reports
- White Paper
- Latest Press Release
- Industry Association
- Paid Database
- Investor Presentations

Step 4 - Data Triangulation
Involves using different sources of information in order to increase the validity of a study
These sources are likely to be stakeholders in a program - participants, other researchers, program staff, other community members, and so on.
Then we put all data in single framework & apply various statistical tools to find out the dynamic on the market.
During the analysis stage, feedback from the stakeholder groups would be compared to determine areas of agreement as well as areas of divergence
