

Key Insights
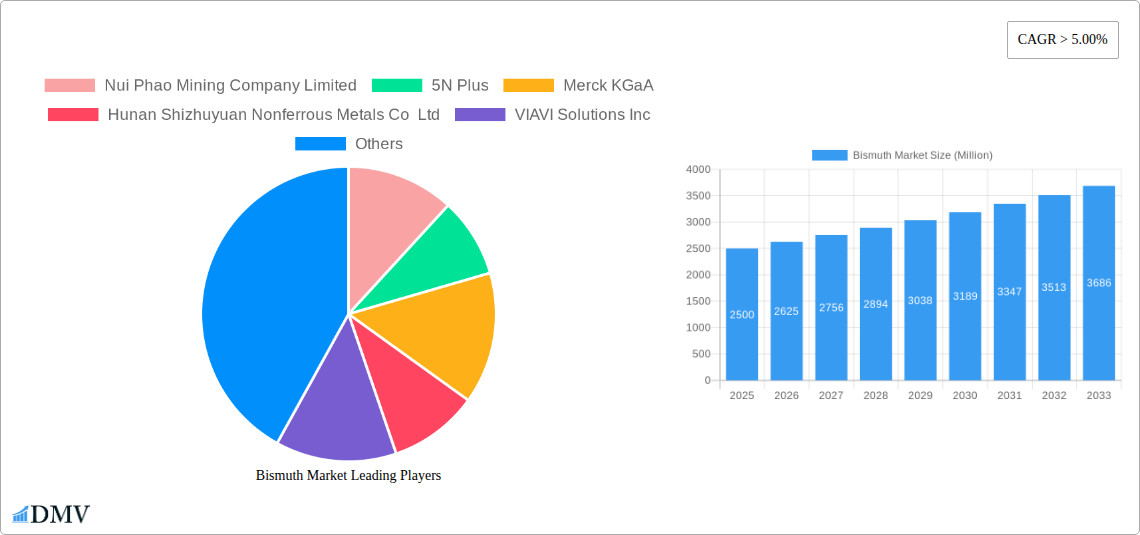
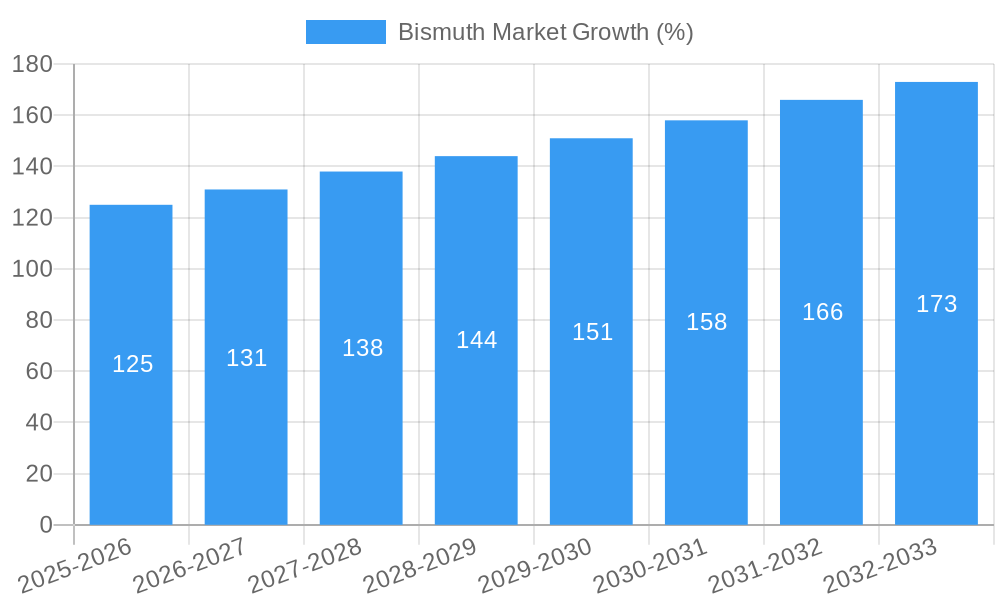
The global bismuth market is experiencing robust growth, projected to maintain a compound annual growth rate (CAGR) exceeding 5% from 2025 to 2033. This expansion is driven by increasing demand across diverse sectors, notably pharmaceuticals, where bismuth compounds are crucial in treating gastrointestinal ailments and as anti-infectives. The automotive industry's utilization of bismuth in alloys for improved performance and durability also contributes significantly to market growth. Furthermore, the electronics sector increasingly employs bismuth in specialized applications, such as solders and specialized alloys requiring high melting points and corrosion resistance. Cosmetics represent another significant end-use segment, leveraging bismuth oxychloride for its pearlescent properties. While supply chain constraints and fluctuating raw material prices pose potential restraints, the overall market outlook remains positive, fueled by technological advancements leading to new applications and increased adoption across various industries.
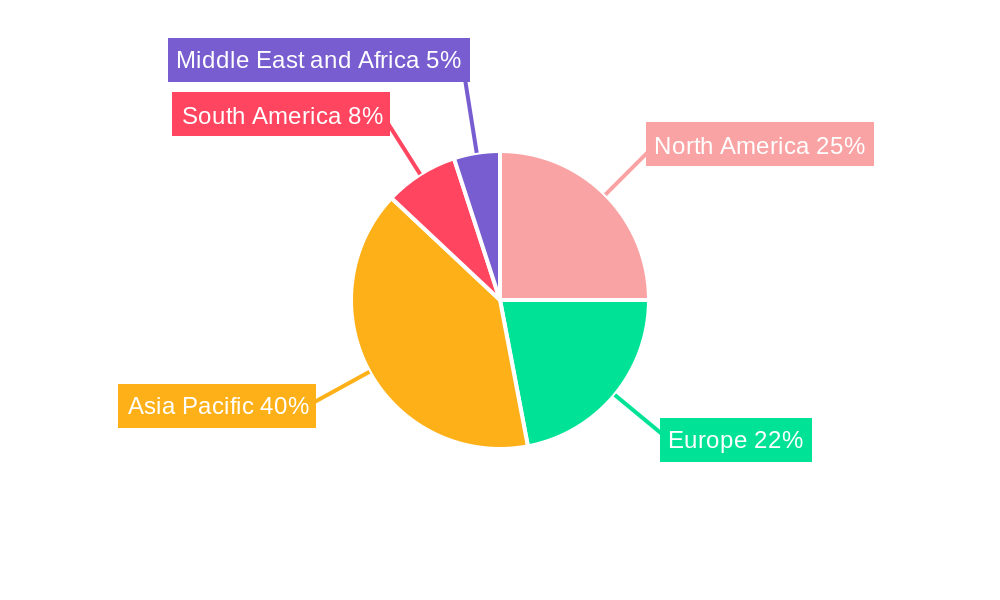
The Asia-Pacific region, particularly China and India, currently dominates the bismuth market, benefiting from substantial manufacturing capabilities and a growing domestic demand. North America and Europe also represent key markets with significant established pharmaceutical and industrial sectors. However, emerging economies in South America, the Middle East, and Africa are demonstrating increasing potential for bismuth market penetration, particularly driven by infrastructure development and industrialization. The market segmentation, encompassing bismuth derivatives like nitrate, oxide, oxychloride, and subcarbonate, further contributes to market complexity and provides diverse opportunities for specialized manufacturers. The competitive landscape features a mix of established players, including BASF SE, Merck KGaA, and smaller, specialized producers, creating a dynamic environment for innovation and market expansion. The market's future trajectory is likely to be shaped by further technological advancements, regulatory changes affecting pharmaceutical applications, and the ongoing exploration of new bismuth applications in diverse technological fields.
Bismuth Market: A Comprehensive Report (2019-2033)
This insightful report provides a detailed analysis of the global bismuth market, encompassing historical data (2019-2024), the base year (2025), and a comprehensive forecast (2025-2033). It delves into market dynamics, competitive landscapes, and future growth potential, offering crucial insights for stakeholders across the value chain. The report covers key segments including derivatives (Bismuth Nitrate, Bismuth Oxide, Bismuth Oxychloride, Bismuth Subcarbonate, and Others), and end-user industries (Pharmaceuticals, Automotive, Electrical & Electronics, Cosmetics, and Others). The total market value is predicted to reach xx Million by 2033.
Bismuth Market Composition & Trends
This section meticulously analyzes the bismuth market's structure and prevailing trends. We evaluate market concentration, identifying key players and their respective market share distribution. For instance, the combined market share of Nui Phao Mining Company Limited, 5N Plus, and Merck KGaA is estimated at xx%. Innovation catalysts, including advancements in bismuth-based materials and applications, are thoroughly examined. The report also explores the regulatory landscape's influence on market growth, highlighting potential impacts of environmental regulations and safety standards. The presence of substitute materials and their competitive impact is assessed, along with an in-depth analysis of end-user profiles and their evolving demands. Finally, the report explores the M&A landscape, quantifying deal values (xx Million in total value for deals between 2019 and 2024) and their impact on market consolidation.
- Market Share Distribution: [Provide data for top 3-5 players, if available. Otherwise, state "Data not available, but analysis reveals a moderately concentrated market."]
- M&A Activity Analysis: [Provide a summary, or if data is unavailable, state "Analysis indicates a moderate level of M&A activity driven by [reason]."]
- Regulatory Landscape Overview: [Summary of key regulations and their impact.]
- Substitute Products Analysis: [Analysis of substitute materials and their market penetration.]
Bismuth Market Industry Evolution
This section charts the bismuth market's evolutionary path, examining market growth trajectories across the study period (2019-2033). We delve into technological advancements that have driven market expansion, focusing on innovations in bismuth-based materials and their integration into diverse applications. The report also analyzes shifting consumer demands, considering factors like increasing demand for electronics and specialized pharmaceutical applications, impacting growth rates. Technological advancements such as the development of bismuth-doped fiber for high-speed data transmission (as seen in the Viavi Solutions collaboration) are evaluated for their impact on market growth. The report includes specific data points on growth rates, with the CAGR for the forecast period (2025-2033) estimated to be xx%.
Leading Regions, Countries, or Segments in Bismuth Market
This section identifies the dominant regions, countries, and segments within the bismuth market. The pharmaceutical segment consistently holds the largest market share, driven by the increasing demand for bismuth-based drugs.
Key Drivers for Pharmaceutical Segment Dominance:
- Growing prevalence of gastrointestinal disorders.
- Rising demand for generic drugs (as highlighted by Par Pharmaceutical's launch).
- Increasing R&D investment in bismuth-based pharmaceuticals.
Other key segments:
- The automotive industry displays significant potential due to expanding applications in catalytic converters and other automotive components. The electrical and electronics segment also shows consistent growth driven by the increasing adoption of bismuth in specialized electronic components.
Geographic Dominance: [Analyze which region or country holds the largest market share and the reasons. Use paragraphs to provide in-depth analysis of dominance factors for the leading region/country, if data is available. Otherwise, use predicted values.]
Bismuth Market Product Innovations
Recent innovations in bismuth-based materials have expanded their applications across diverse sectors. Advancements in synthesis techniques have led to the development of higher-purity bismuth compounds, improving performance in applications like catalysts and electronics. These innovations, coupled with improvements in bismuth-doped fiber technology, have opened new opportunities in telecommunications and other high-growth sectors. The unique selling propositions of these advanced bismuth-based materials lie in their enhanced properties such as improved thermal stability, electrical conductivity, and catalytic activity.
Propelling Factors for Bismuth Market Growth
Several factors contribute to the bismuth market's growth trajectory. Technological advancements, particularly in bismuth-doped fiber optics and specialized pharmaceutical applications, are key drivers. Economic factors, including rising disposable incomes in emerging economies and increased investment in infrastructure projects (especially in telecommunications), fuel demand. Favorable regulatory environments in some regions further stimulate market expansion.
Obstacles in the Bismuth Market
The bismuth market faces challenges such as price volatility due to supply chain disruptions and fluctuating raw material costs. Stringent environmental regulations pose another hurdle, necessitating compliance with increasingly stricter emission standards. Furthermore, competitive pressures from substitute materials and the emergence of new technologies can impact market growth, with the projected impact valued at xx Million in lost revenue by 2033.
Future Opportunities in Bismuth Market
Emerging opportunities lie in expanding applications of bismuth-based materials in novel sectors, including advanced electronics, energy storage, and high-performance catalysis. Technological advancements in bismuth synthesis and processing will unlock new possibilities. Growing demand for bismuth in specialized medical applications further presents lucrative market expansion opportunities.
Major Players in the Bismuth Market Ecosystem
- Nui Phao Mining Company Limited
- 5N Plus
- Merck KGaA
- Hunan Shizhuyuan Nonferrous Metals Co Ltd
- VIAVI Solutions Inc
- BASF SE
- Industrias Peñoles
- Fortune Minerals
- Xianyang Yuehua Bismuth Co Ltd
- Par Pharmaceutical (Endo International plc)
Key Developments in Bismuth Market Industry
- March 2023: Endo International plc's Par Pharmaceutical launched a generic version of Allergan's Pylera®, significantly impacting the pharmaceutical segment.
- March 2022: The collaboration between OFS and Viavi Solutions on bismuth-doped fiber for 400GbE and 800GbE testing applications signifies a technological leap in the telecommunications sector.
Strategic Bismuth Market Forecast
The bismuth market exhibits strong growth potential, driven by technological advancements, expanding applications across multiple sectors, and supportive regulatory environments in some key regions. Continued R&D efforts and strategic partnerships are expected to drive innovation, fostering significant market expansion in the coming years, with an expected market value of xx Million by 2033.
Bismuth Market Segmentation
-
1. Derivatives
- 1.1. Bismuth Nitrate
- 1.2. Bismuth Oxide
- 1.3. Bismuth Oxychloride
- 1.4. Bismuth Subcarbonate
- 1.5. Other Derivatives
-
2. End-user Industry
- 2.1. Pharmaceuticals
- 2.2. Automotive
- 2.3. Electrical and Electronics
- 2.4. Cosmetics
- 2.5. Other End-user Industries
Bismuth Market Segmentation By Geography
- 1. China
- 2. India
- 3. Japan
- 4. South Korea
-
5. Rest of Asia Pacific
- 5.1. North America
- 6. United States
- 7. Canada
-
8. Mexico
- 8.1. Europe
- 9. Germany
- 10. United Kingdom
- 11. Italy
- 12. France
-
13. Rest of Europe
- 13.1. South America
- 14. Brazil
- 15. Argentina
-
16. Rest of South America
- 16.1. Middle East and Africa
- 17. Saudi Arabia
- 18. South Africa
- 19. Rest of Middle East and Africa
Bismuth Market REPORT HIGHLIGHTS
| Aspects | Details |
|---|---|
| Study Period | 2019-2033 |
| Base Year | 2024 |
| Estimated Year | 2025 |
| Forecast Period | 2025-2033 |
| Historical Period | 2019-2024 |
| Growth Rate | CAGR of > 5.00% from 2019-2033 |
| Segmentation |
|
Table of Contents
- 1. Introduction
- 1.1. Research Scope
- 1.2. Market Segmentation
- 1.3. Research Methodology
- 1.4. Definitions and Assumptions
- 2. Executive Summary
- 2.1. Introduction
- 3. Market Dynamics
- 3.1. Introduction
- 3.2. Market Drivers
- 3.2.1. Growing Use of Bismuth in Automobile Industry to Protect Brake Linings; Widespread Use of Bismuth in the Pharmaceutical Industry
- 3.3. Market Restrains
- 3.3.1. Harm Done to the Human Body by Working with Bismuth; Limited Use of Bismuth due to Other Cost-effective Options
- 3.4. Market Trends
- 3.4.1. Pharmaceuticals Industry to Dominate the Market
- 4. Market Factor Analysis
- 4.1. Porters Five Forces
- 4.2. Supply/Value Chain
- 4.3. PESTEL analysis
- 4.4. Market Entropy
- 4.5. Patent/Trademark Analysis
- 5. Global Bismuth Market Analysis, Insights and Forecast, 2019-2031
- 5.1. Market Analysis, Insights and Forecast - by Derivatives
- 5.1.1. Bismuth Nitrate
- 5.1.2. Bismuth Oxide
- 5.1.3. Bismuth Oxychloride
- 5.1.4. Bismuth Subcarbonate
- 5.1.5. Other Derivatives
- 5.2. Market Analysis, Insights and Forecast - by End-user Industry
- 5.2.1. Pharmaceuticals
- 5.2.2. Automotive
- 5.2.3. Electrical and Electronics
- 5.2.4. Cosmetics
- 5.2.5. Other End-user Industries
- 5.3. Market Analysis, Insights and Forecast - by Region
- 5.3.1. China
- 5.3.2. India
- 5.3.3. Japan
- 5.3.4. South Korea
- 5.3.5. Rest of Asia Pacific
- 5.3.6. United States
- 5.3.7. Canada
- 5.3.8. Mexico
- 5.3.9. Germany
- 5.3.10. United Kingdom
- 5.3.11. Italy
- 5.3.12. France
- 5.3.13. Rest of Europe
- 5.3.14. Brazil
- 5.3.15. Argentina
- 5.3.16. Rest of South America
- 5.3.17. Saudi Arabia
- 5.3.18. South Africa
- 5.3.19. Rest of Middle East and Africa
- 5.1. Market Analysis, Insights and Forecast - by Derivatives
- 6. China Bismuth Market Analysis, Insights and Forecast, 2019-2031
- 6.1. Market Analysis, Insights and Forecast - by Derivatives
- 6.1.1. Bismuth Nitrate
- 6.1.2. Bismuth Oxide
- 6.1.3. Bismuth Oxychloride
- 6.1.4. Bismuth Subcarbonate
- 6.1.5. Other Derivatives
- 6.2. Market Analysis, Insights and Forecast - by End-user Industry
- 6.2.1. Pharmaceuticals
- 6.2.2. Automotive
- 6.2.3. Electrical and Electronics
- 6.2.4. Cosmetics
- 6.2.5. Other End-user Industries
- 6.1. Market Analysis, Insights and Forecast - by Derivatives
- 7. India Bismuth Market Analysis, Insights and Forecast, 2019-2031
- 7.1. Market Analysis, Insights and Forecast - by Derivatives
- 7.1.1. Bismuth Nitrate
- 7.1.2. Bismuth Oxide
- 7.1.3. Bismuth Oxychloride
- 7.1.4. Bismuth Subcarbonate
- 7.1.5. Other Derivatives
- 7.2. Market Analysis, Insights and Forecast - by End-user Industry
- 7.2.1. Pharmaceuticals
- 7.2.2. Automotive
- 7.2.3. Electrical and Electronics
- 7.2.4. Cosmetics
- 7.2.5. Other End-user Industries
- 7.1. Market Analysis, Insights and Forecast - by Derivatives
- 8. Japan Bismuth Market Analysis, Insights and Forecast, 2019-2031
- 8.1. Market Analysis, Insights and Forecast - by Derivatives
- 8.1.1. Bismuth Nitrate
- 8.1.2. Bismuth Oxide
- 8.1.3. Bismuth Oxychloride
- 8.1.4. Bismuth Subcarbonate
- 8.1.5. Other Derivatives
- 8.2. Market Analysis, Insights and Forecast - by End-user Industry
- 8.2.1. Pharmaceuticals
- 8.2.2. Automotive
- 8.2.3. Electrical and Electronics
- 8.2.4. Cosmetics
- 8.2.5. Other End-user Industries
- 8.1. Market Analysis, Insights and Forecast - by Derivatives
- 9. South Korea Bismuth Market Analysis, Insights and Forecast, 2019-2031
- 9.1. Market Analysis, Insights and Forecast - by Derivatives
- 9.1.1. Bismuth Nitrate
- 9.1.2. Bismuth Oxide
- 9.1.3. Bismuth Oxychloride
- 9.1.4. Bismuth Subcarbonate
- 9.1.5. Other Derivatives
- 9.2. Market Analysis, Insights and Forecast - by End-user Industry
- 9.2.1. Pharmaceuticals
- 9.2.2. Automotive
- 9.2.3. Electrical and Electronics
- 9.2.4. Cosmetics
- 9.2.5. Other End-user Industries
- 9.1. Market Analysis, Insights and Forecast - by Derivatives
- 10. Rest of Asia Pacific Bismuth Market Analysis, Insights and Forecast, 2019-2031
- 10.1. Market Analysis, Insights and Forecast - by Derivatives
- 10.1.1. Bismuth Nitrate
- 10.1.2. Bismuth Oxide
- 10.1.3. Bismuth Oxychloride
- 10.1.4. Bismuth Subcarbonate
- 10.1.5. Other Derivatives
- 10.2. Market Analysis, Insights and Forecast - by End-user Industry
- 10.2.1. Pharmaceuticals
- 10.2.2. Automotive
- 10.2.3. Electrical and Electronics
- 10.2.4. Cosmetics
- 10.2.5. Other End-user Industries
- 10.1. Market Analysis, Insights and Forecast - by Derivatives
- 11. United States Bismuth Market Analysis, Insights and Forecast, 2019-2031
- 11.1. Market Analysis, Insights and Forecast - by Derivatives
- 11.1.1. Bismuth Nitrate
- 11.1.2. Bismuth Oxide
- 11.1.3. Bismuth Oxychloride
- 11.1.4. Bismuth Subcarbonate
- 11.1.5. Other Derivatives
- 11.2. Market Analysis, Insights and Forecast - by End-user Industry
- 11.2.1. Pharmaceuticals
- 11.2.2. Automotive
- 11.2.3. Electrical and Electronics
- 11.2.4. Cosmetics
- 11.2.5. Other End-user Industries
- 11.1. Market Analysis, Insights and Forecast - by Derivatives
- 12. Canada Bismuth Market Analysis, Insights and Forecast, 2019-2031
- 12.1. Market Analysis, Insights and Forecast - by Derivatives
- 12.1.1. Bismuth Nitrate
- 12.1.2. Bismuth Oxide
- 12.1.3. Bismuth Oxychloride
- 12.1.4. Bismuth Subcarbonate
- 12.1.5. Other Derivatives
- 12.2. Market Analysis, Insights and Forecast - by End-user Industry
- 12.2.1. Pharmaceuticals
- 12.2.2. Automotive
- 12.2.3. Electrical and Electronics
- 12.2.4. Cosmetics
- 12.2.5. Other End-user Industries
- 12.1. Market Analysis, Insights and Forecast - by Derivatives
- 13. Mexico Bismuth Market Analysis, Insights and Forecast, 2019-2031
- 13.1. Market Analysis, Insights and Forecast - by Derivatives
- 13.1.1. Bismuth Nitrate
- 13.1.2. Bismuth Oxide
- 13.1.3. Bismuth Oxychloride
- 13.1.4. Bismuth Subcarbonate
- 13.1.5. Other Derivatives
- 13.2. Market Analysis, Insights and Forecast - by End-user Industry
- 13.2.1. Pharmaceuticals
- 13.2.2. Automotive
- 13.2.3. Electrical and Electronics
- 13.2.4. Cosmetics
- 13.2.5. Other End-user Industries
- 13.1. Market Analysis, Insights and Forecast - by Derivatives
- 14. Germany Bismuth Market Analysis, Insights and Forecast, 2019-2031
- 14.1. Market Analysis, Insights and Forecast - by Derivatives
- 14.1.1. Bismuth Nitrate
- 14.1.2. Bismuth Oxide
- 14.1.3. Bismuth Oxychloride
- 14.1.4. Bismuth Subcarbonate
- 14.1.5. Other Derivatives
- 14.2. Market Analysis, Insights and Forecast - by End-user Industry
- 14.2.1. Pharmaceuticals
- 14.2.2. Automotive
- 14.2.3. Electrical and Electronics
- 14.2.4. Cosmetics
- 14.2.5. Other End-user Industries
- 14.1. Market Analysis, Insights and Forecast - by Derivatives
- 15. United Kingdom Bismuth Market Analysis, Insights and Forecast, 2019-2031
- 15.1. Market Analysis, Insights and Forecast - by Derivatives
- 15.1.1. Bismuth Nitrate
- 15.1.2. Bismuth Oxide
- 15.1.3. Bismuth Oxychloride
- 15.1.4. Bismuth Subcarbonate
- 15.1.5. Other Derivatives
- 15.2. Market Analysis, Insights and Forecast - by End-user Industry
- 15.2.1. Pharmaceuticals
- 15.2.2. Automotive
- 15.2.3. Electrical and Electronics
- 15.2.4. Cosmetics
- 15.2.5. Other End-user Industries
- 15.1. Market Analysis, Insights and Forecast - by Derivatives
- 16. Italy Bismuth Market Analysis, Insights and Forecast, 2019-2031
- 16.1. Market Analysis, Insights and Forecast - by Derivatives
- 16.1.1. Bismuth Nitrate
- 16.1.2. Bismuth Oxide
- 16.1.3. Bismuth Oxychloride
- 16.1.4. Bismuth Subcarbonate
- 16.1.5. Other Derivatives
- 16.2. Market Analysis, Insights and Forecast - by End-user Industry
- 16.2.1. Pharmaceuticals
- 16.2.2. Automotive
- 16.2.3. Electrical and Electronics
- 16.2.4. Cosmetics
- 16.2.5. Other End-user Industries
- 16.1. Market Analysis, Insights and Forecast - by Derivatives
- 17. France Bismuth Market Analysis, Insights and Forecast, 2019-2031
- 17.1. Market Analysis, Insights and Forecast - by Derivatives
- 17.1.1. Bismuth Nitrate
- 17.1.2. Bismuth Oxide
- 17.1.3. Bismuth Oxychloride
- 17.1.4. Bismuth Subcarbonate
- 17.1.5. Other Derivatives
- 17.2. Market Analysis, Insights and Forecast - by End-user Industry
- 17.2.1. Pharmaceuticals
- 17.2.2. Automotive
- 17.2.3. Electrical and Electronics
- 17.2.4. Cosmetics
- 17.2.5. Other End-user Industries
- 17.1. Market Analysis, Insights and Forecast - by Derivatives
- 18. Rest of Europe Bismuth Market Analysis, Insights and Forecast, 2019-2031
- 18.1. Market Analysis, Insights and Forecast - by Derivatives
- 18.1.1. Bismuth Nitrate
- 18.1.2. Bismuth Oxide
- 18.1.3. Bismuth Oxychloride
- 18.1.4. Bismuth Subcarbonate
- 18.1.5. Other Derivatives
- 18.2. Market Analysis, Insights and Forecast - by End-user Industry
- 18.2.1. Pharmaceuticals
- 18.2.2. Automotive
- 18.2.3. Electrical and Electronics
- 18.2.4. Cosmetics
- 18.2.5. Other End-user Industries
- 18.1. Market Analysis, Insights and Forecast - by Derivatives
- 19. Brazil Bismuth Market Analysis, Insights and Forecast, 2019-2031
- 19.1. Market Analysis, Insights and Forecast - by Derivatives
- 19.1.1. Bismuth Nitrate
- 19.1.2. Bismuth Oxide
- 19.1.3. Bismuth Oxychloride
- 19.1.4. Bismuth Subcarbonate
- 19.1.5. Other Derivatives
- 19.2. Market Analysis, Insights and Forecast - by End-user Industry
- 19.2.1. Pharmaceuticals
- 19.2.2. Automotive
- 19.2.3. Electrical and Electronics
- 19.2.4. Cosmetics
- 19.2.5. Other End-user Industries
- 19.1. Market Analysis, Insights and Forecast - by Derivatives
- 20. Argentina Bismuth Market Analysis, Insights and Forecast, 2019-2031
- 20.1. Market Analysis, Insights and Forecast - by Derivatives
- 20.1.1. Bismuth Nitrate
- 20.1.2. Bismuth Oxide
- 20.1.3. Bismuth Oxychloride
- 20.1.4. Bismuth Subcarbonate
- 20.1.5. Other Derivatives
- 20.2. Market Analysis, Insights and Forecast - by End-user Industry
- 20.2.1. Pharmaceuticals
- 20.2.2. Automotive
- 20.2.3. Electrical and Electronics
- 20.2.4. Cosmetics
- 20.2.5. Other End-user Industries
- 20.1. Market Analysis, Insights and Forecast - by Derivatives
- 21. Rest of South America Bismuth Market Analysis, Insights and Forecast, 2019-2031
- 21.1. Market Analysis, Insights and Forecast - by Derivatives
- 21.1.1. Bismuth Nitrate
- 21.1.2. Bismuth Oxide
- 21.1.3. Bismuth Oxychloride
- 21.1.4. Bismuth Subcarbonate
- 21.1.5. Other Derivatives
- 21.2. Market Analysis, Insights and Forecast - by End-user Industry
- 21.2.1. Pharmaceuticals
- 21.2.2. Automotive
- 21.2.3. Electrical and Electronics
- 21.2.4. Cosmetics
- 21.2.5. Other End-user Industries
- 21.1. Market Analysis, Insights and Forecast - by Derivatives
- 22. Saudi Arabia Bismuth Market Analysis, Insights and Forecast, 2019-2031
- 22.1. Market Analysis, Insights and Forecast - by Derivatives
- 22.1.1. Bismuth Nitrate
- 22.1.2. Bismuth Oxide
- 22.1.3. Bismuth Oxychloride
- 22.1.4. Bismuth Subcarbonate
- 22.1.5. Other Derivatives
- 22.2. Market Analysis, Insights and Forecast - by End-user Industry
- 22.2.1. Pharmaceuticals
- 22.2.2. Automotive
- 22.2.3. Electrical and Electronics
- 22.2.4. Cosmetics
- 22.2.5. Other End-user Industries
- 22.1. Market Analysis, Insights and Forecast - by Derivatives
- 23. South Africa Bismuth Market Analysis, Insights and Forecast, 2019-2031
- 23.1. Market Analysis, Insights and Forecast - by Derivatives
- 23.1.1. Bismuth Nitrate
- 23.1.2. Bismuth Oxide
- 23.1.3. Bismuth Oxychloride
- 23.1.4. Bismuth Subcarbonate
- 23.1.5. Other Derivatives
- 23.2. Market Analysis, Insights and Forecast - by End-user Industry
- 23.2.1. Pharmaceuticals
- 23.2.2. Automotive
- 23.2.3. Electrical and Electronics
- 23.2.4. Cosmetics
- 23.2.5. Other End-user Industries
- 23.1. Market Analysis, Insights and Forecast - by Derivatives
- 24. Rest of Middle East and Africa Bismuth Market Analysis, Insights and Forecast, 2019-2031
- 24.1. Market Analysis, Insights and Forecast - by Derivatives
- 24.1.1. Bismuth Nitrate
- 24.1.2. Bismuth Oxide
- 24.1.3. Bismuth Oxychloride
- 24.1.4. Bismuth Subcarbonate
- 24.1.5. Other Derivatives
- 24.2. Market Analysis, Insights and Forecast - by End-user Industry
- 24.2.1. Pharmaceuticals
- 24.2.2. Automotive
- 24.2.3. Electrical and Electronics
- 24.2.4. Cosmetics
- 24.2.5. Other End-user Industries
- 24.1. Market Analysis, Insights and Forecast - by Derivatives
- 25. Asia Pacific Bismuth Market Analysis, Insights and Forecast, 2019-2031
- 25.1. Market Analysis, Insights and Forecast - By Country/Sub-region
- 25.1.1 China
- 25.1.2 India
- 25.1.3 Japan
- 25.1.4 South Korea
- 25.1.5 Rest of Asia Pacific
- 26. North America Bismuth Market Analysis, Insights and Forecast, 2019-2031
- 26.1. Market Analysis, Insights and Forecast - By Country/Sub-region
- 26.1.1 United States
- 26.1.2 Canada
- 26.1.3 Mexico
- 27. Europe Bismuth Market Analysis, Insights and Forecast, 2019-2031
- 27.1. Market Analysis, Insights and Forecast - By Country/Sub-region
- 27.1.1 Germany
- 27.1.2 United Kingdom
- 27.1.3 Italy
- 27.1.4 France
- 27.1.5 Rest of Europe
- 28. South America Bismuth Market Analysis, Insights and Forecast, 2019-2031
- 28.1. Market Analysis, Insights and Forecast - By Country/Sub-region
- 28.1.1 Brazil
- 28.1.2 Argentina
- 28.1.3 Rest of South America
- 29. Middle East and Africa Bismuth Market Analysis, Insights and Forecast, 2019-2031
- 29.1. Market Analysis, Insights and Forecast - By Country/Sub-region
- 29.1.1 Saudi Arabia
- 29.1.2 South Africa
- 29.1.3 Rest of Middle East and Africa
- 30. Competitive Analysis
- 30.1. Global Market Share Analysis 2024
- 30.2. Company Profiles
- 30.2.1 Nui Phao Mining Company Limited
- 30.2.1.1. Overview
- 30.2.1.2. Products
- 30.2.1.3. SWOT Analysis
- 30.2.1.4. Recent Developments
- 30.2.1.5. Financials (Based on Availability)
- 30.2.2 5N Plus
- 30.2.2.1. Overview
- 30.2.2.2. Products
- 30.2.2.3. SWOT Analysis
- 30.2.2.4. Recent Developments
- 30.2.2.5. Financials (Based on Availability)
- 30.2.3 Merck KGaA
- 30.2.3.1. Overview
- 30.2.3.2. Products
- 30.2.3.3. SWOT Analysis
- 30.2.3.4. Recent Developments
- 30.2.3.5. Financials (Based on Availability)
- 30.2.4 Hunan Shizhuyuan Nonferrous Metals Co Ltd
- 30.2.4.1. Overview
- 30.2.4.2. Products
- 30.2.4.3. SWOT Analysis
- 30.2.4.4. Recent Developments
- 30.2.4.5. Financials (Based on Availability)
- 30.2.5 VIAVI Solutions Inc
- 30.2.5.1. Overview
- 30.2.5.2. Products
- 30.2.5.3. SWOT Analysis
- 30.2.5.4. Recent Developments
- 30.2.5.5. Financials (Based on Availability)
- 30.2.6 BASF SE
- 30.2.6.1. Overview
- 30.2.6.2. Products
- 30.2.6.3. SWOT Analysis
- 30.2.6.4. Recent Developments
- 30.2.6.5. Financials (Based on Availability)
- 30.2.7 Industrias Peñoles
- 30.2.7.1. Overview
- 30.2.7.2. Products
- 30.2.7.3. SWOT Analysis
- 30.2.7.4. Recent Developments
- 30.2.7.5. Financials (Based on Availability)
- 30.2.8 Fortune Minerals
- 30.2.8.1. Overview
- 30.2.8.2. Products
- 30.2.8.3. SWOT Analysis
- 30.2.8.4. Recent Developments
- 30.2.8.5. Financials (Based on Availability)
- 30.2.9 Xianyang Yuehua Bismuth Co Ltd *List Not Exhaustive
- 30.2.9.1. Overview
- 30.2.9.2. Products
- 30.2.9.3. SWOT Analysis
- 30.2.9.4. Recent Developments
- 30.2.9.5. Financials (Based on Availability)
- 30.2.10 Par Pharmaceutical (Endo International plc)
- 30.2.10.1. Overview
- 30.2.10.2. Products
- 30.2.10.3. SWOT Analysis
- 30.2.10.4. Recent Developments
- 30.2.10.5. Financials (Based on Availability)
- 30.2.1 Nui Phao Mining Company Limited
List of Figures
- Figure 1: Global Bismuth Market Revenue Breakdown (Million, %) by Region 2024 & 2032
- Figure 2: Asia Pacific Bismuth Market Revenue (Million), by Country 2024 & 2032
- Figure 3: Asia Pacific Bismuth Market Revenue Share (%), by Country 2024 & 2032
- Figure 4: North America Bismuth Market Revenue (Million), by Country 2024 & 2032
- Figure 5: North America Bismuth Market Revenue Share (%), by Country 2024 & 2032
- Figure 6: Europe Bismuth Market Revenue (Million), by Country 2024 & 2032
- Figure 7: Europe Bismuth Market Revenue Share (%), by Country 2024 & 2032
- Figure 8: South America Bismuth Market Revenue (Million), by Country 2024 & 2032
- Figure 9: South America Bismuth Market Revenue Share (%), by Country 2024 & 2032
- Figure 10: Middle East and Africa Bismuth Market Revenue (Million), by Country 2024 & 2032
- Figure 11: Middle East and Africa Bismuth Market Revenue Share (%), by Country 2024 & 2032
- Figure 12: China Bismuth Market Revenue (Million), by Derivatives 2024 & 2032
- Figure 13: China Bismuth Market Revenue Share (%), by Derivatives 2024 & 2032
- Figure 14: China Bismuth Market Revenue (Million), by End-user Industry 2024 & 2032
- Figure 15: China Bismuth Market Revenue Share (%), by End-user Industry 2024 & 2032
- Figure 16: China Bismuth Market Revenue (Million), by Country 2024 & 2032
- Figure 17: China Bismuth Market Revenue Share (%), by Country 2024 & 2032
- Figure 18: India Bismuth Market Revenue (Million), by Derivatives 2024 & 2032
- Figure 19: India Bismuth Market Revenue Share (%), by Derivatives 2024 & 2032
- Figure 20: India Bismuth Market Revenue (Million), by End-user Industry 2024 & 2032
- Figure 21: India Bismuth Market Revenue Share (%), by End-user Industry 2024 & 2032
- Figure 22: India Bismuth Market Revenue (Million), by Country 2024 & 2032
- Figure 23: India Bismuth Market Revenue Share (%), by Country 2024 & 2032
- Figure 24: Japan Bismuth Market Revenue (Million), by Derivatives 2024 & 2032
- Figure 25: Japan Bismuth Market Revenue Share (%), by Derivatives 2024 & 2032
- Figure 26: Japan Bismuth Market Revenue (Million), by End-user Industry 2024 & 2032
- Figure 27: Japan Bismuth Market Revenue Share (%), by End-user Industry 2024 & 2032
- Figure 28: Japan Bismuth Market Revenue (Million), by Country 2024 & 2032
- Figure 29: Japan Bismuth Market Revenue Share (%), by Country 2024 & 2032
- Figure 30: South Korea Bismuth Market Revenue (Million), by Derivatives 2024 & 2032
- Figure 31: South Korea Bismuth Market Revenue Share (%), by Derivatives 2024 & 2032
- Figure 32: South Korea Bismuth Market Revenue (Million), by End-user Industry 2024 & 2032
- Figure 33: South Korea Bismuth Market Revenue Share (%), by End-user Industry 2024 & 2032
- Figure 34: South Korea Bismuth Market Revenue (Million), by Country 2024 & 2032
- Figure 35: South Korea Bismuth Market Revenue Share (%), by Country 2024 & 2032
- Figure 36: Rest of Asia Pacific Bismuth Market Revenue (Million), by Derivatives 2024 & 2032
- Figure 37: Rest of Asia Pacific Bismuth Market Revenue Share (%), by Derivatives 2024 & 2032
- Figure 38: Rest of Asia Pacific Bismuth Market Revenue (Million), by End-user Industry 2024 & 2032
- Figure 39: Rest of Asia Pacific Bismuth Market Revenue Share (%), by End-user Industry 2024 & 2032
- Figure 40: Rest of Asia Pacific Bismuth Market Revenue (Million), by Country 2024 & 2032
- Figure 41: Rest of Asia Pacific Bismuth Market Revenue Share (%), by Country 2024 & 2032
- Figure 42: United States Bismuth Market Revenue (Million), by Derivatives 2024 & 2032
- Figure 43: United States Bismuth Market Revenue Share (%), by Derivatives 2024 & 2032
- Figure 44: United States Bismuth Market Revenue (Million), by End-user Industry 2024 & 2032
- Figure 45: United States Bismuth Market Revenue Share (%), by End-user Industry 2024 & 2032
- Figure 46: United States Bismuth Market Revenue (Million), by Country 2024 & 2032
- Figure 47: United States Bismuth Market Revenue Share (%), by Country 2024 & 2032
- Figure 48: Canada Bismuth Market Revenue (Million), by Derivatives 2024 & 2032
- Figure 49: Canada Bismuth Market Revenue Share (%), by Derivatives 2024 & 2032
- Figure 50: Canada Bismuth Market Revenue (Million), by End-user Industry 2024 & 2032
- Figure 51: Canada Bismuth Market Revenue Share (%), by End-user Industry 2024 & 2032
- Figure 52: Canada Bismuth Market Revenue (Million), by Country 2024 & 2032
- Figure 53: Canada Bismuth Market Revenue Share (%), by Country 2024 & 2032
- Figure 54: Mexico Bismuth Market Revenue (Million), by Derivatives 2024 & 2032
- Figure 55: Mexico Bismuth Market Revenue Share (%), by Derivatives 2024 & 2032
- Figure 56: Mexico Bismuth Market Revenue (Million), by End-user Industry 2024 & 2032
- Figure 57: Mexico Bismuth Market Revenue Share (%), by End-user Industry 2024 & 2032
- Figure 58: Mexico Bismuth Market Revenue (Million), by Country 2024 & 2032
- Figure 59: Mexico Bismuth Market Revenue Share (%), by Country 2024 & 2032
- Figure 60: Germany Bismuth Market Revenue (Million), by Derivatives 2024 & 2032
- Figure 61: Germany Bismuth Market Revenue Share (%), by Derivatives 2024 & 2032
- Figure 62: Germany Bismuth Market Revenue (Million), by End-user Industry 2024 & 2032
- Figure 63: Germany Bismuth Market Revenue Share (%), by End-user Industry 2024 & 2032
- Figure 64: Germany Bismuth Market Revenue (Million), by Country 2024 & 2032
- Figure 65: Germany Bismuth Market Revenue Share (%), by Country 2024 & 2032
- Figure 66: United Kingdom Bismuth Market Revenue (Million), by Derivatives 2024 & 2032
- Figure 67: United Kingdom Bismuth Market Revenue Share (%), by Derivatives 2024 & 2032
- Figure 68: United Kingdom Bismuth Market Revenue (Million), by End-user Industry 2024 & 2032
- Figure 69: United Kingdom Bismuth Market Revenue Share (%), by End-user Industry 2024 & 2032
- Figure 70: United Kingdom Bismuth Market Revenue (Million), by Country 2024 & 2032
- Figure 71: United Kingdom Bismuth Market Revenue Share (%), by Country 2024 & 2032
- Figure 72: Italy Bismuth Market Revenue (Million), by Derivatives 2024 & 2032
- Figure 73: Italy Bismuth Market Revenue Share (%), by Derivatives 2024 & 2032
- Figure 74: Italy Bismuth Market Revenue (Million), by End-user Industry 2024 & 2032
- Figure 75: Italy Bismuth Market Revenue Share (%), by End-user Industry 2024 & 2032
- Figure 76: Italy Bismuth Market Revenue (Million), by Country 2024 & 2032
- Figure 77: Italy Bismuth Market Revenue Share (%), by Country 2024 & 2032
- Figure 78: France Bismuth Market Revenue (Million), by Derivatives 2024 & 2032
- Figure 79: France Bismuth Market Revenue Share (%), by Derivatives 2024 & 2032
- Figure 80: France Bismuth Market Revenue (Million), by End-user Industry 2024 & 2032
- Figure 81: France Bismuth Market Revenue Share (%), by End-user Industry 2024 & 2032
- Figure 82: France Bismuth Market Revenue (Million), by Country 2024 & 2032
- Figure 83: France Bismuth Market Revenue Share (%), by Country 2024 & 2032
- Figure 84: Rest of Europe Bismuth Market Revenue (Million), by Derivatives 2024 & 2032
- Figure 85: Rest of Europe Bismuth Market Revenue Share (%), by Derivatives 2024 & 2032
- Figure 86: Rest of Europe Bismuth Market Revenue (Million), by End-user Industry 2024 & 2032
- Figure 87: Rest of Europe Bismuth Market Revenue Share (%), by End-user Industry 2024 & 2032
- Figure 88: Rest of Europe Bismuth Market Revenue (Million), by Country 2024 & 2032
- Figure 89: Rest of Europe Bismuth Market Revenue Share (%), by Country 2024 & 2032
- Figure 90: Brazil Bismuth Market Revenue (Million), by Derivatives 2024 & 2032
- Figure 91: Brazil Bismuth Market Revenue Share (%), by Derivatives 2024 & 2032
- Figure 92: Brazil Bismuth Market Revenue (Million), by End-user Industry 2024 & 2032
- Figure 93: Brazil Bismuth Market Revenue Share (%), by End-user Industry 2024 & 2032
- Figure 94: Brazil Bismuth Market Revenue (Million), by Country 2024 & 2032
- Figure 95: Brazil Bismuth Market Revenue Share (%), by Country 2024 & 2032
- Figure 96: Argentina Bismuth Market Revenue (Million), by Derivatives 2024 & 2032
- Figure 97: Argentina Bismuth Market Revenue Share (%), by Derivatives 2024 & 2032
- Figure 98: Argentina Bismuth Market Revenue (Million), by End-user Industry 2024 & 2032
- Figure 99: Argentina Bismuth Market Revenue Share (%), by End-user Industry 2024 & 2032
- Figure 100: Argentina Bismuth Market Revenue (Million), by Country 2024 & 2032
- Figure 101: Argentina Bismuth Market Revenue Share (%), by Country 2024 & 2032
- Figure 102: Rest of South America Bismuth Market Revenue (Million), by Derivatives 2024 & 2032
- Figure 103: Rest of South America Bismuth Market Revenue Share (%), by Derivatives 2024 & 2032
- Figure 104: Rest of South America Bismuth Market Revenue (Million), by End-user Industry 2024 & 2032
- Figure 105: Rest of South America Bismuth Market Revenue Share (%), by End-user Industry 2024 & 2032
- Figure 106: Rest of South America Bismuth Market Revenue (Million), by Country 2024 & 2032
- Figure 107: Rest of South America Bismuth Market Revenue Share (%), by Country 2024 & 2032
- Figure 108: Saudi Arabia Bismuth Market Revenue (Million), by Derivatives 2024 & 2032
- Figure 109: Saudi Arabia Bismuth Market Revenue Share (%), by Derivatives 2024 & 2032
- Figure 110: Saudi Arabia Bismuth Market Revenue (Million), by End-user Industry 2024 & 2032
- Figure 111: Saudi Arabia Bismuth Market Revenue Share (%), by End-user Industry 2024 & 2032
- Figure 112: Saudi Arabia Bismuth Market Revenue (Million), by Country 2024 & 2032
- Figure 113: Saudi Arabia Bismuth Market Revenue Share (%), by Country 2024 & 2032
- Figure 114: South Africa Bismuth Market Revenue (Million), by Derivatives 2024 & 2032
- Figure 115: South Africa Bismuth Market Revenue Share (%), by Derivatives 2024 & 2032
- Figure 116: South Africa Bismuth Market Revenue (Million), by End-user Industry 2024 & 2032
- Figure 117: South Africa Bismuth Market Revenue Share (%), by End-user Industry 2024 & 2032
- Figure 118: South Africa Bismuth Market Revenue (Million), by Country 2024 & 2032
- Figure 119: South Africa Bismuth Market Revenue Share (%), by Country 2024 & 2032
- Figure 120: Rest of Middle East and Africa Bismuth Market Revenue (Million), by Derivatives 2024 & 2032
- Figure 121: Rest of Middle East and Africa Bismuth Market Revenue Share (%), by Derivatives 2024 & 2032
- Figure 122: Rest of Middle East and Africa Bismuth Market Revenue (Million), by End-user Industry 2024 & 2032
- Figure 123: Rest of Middle East and Africa Bismuth Market Revenue Share (%), by End-user Industry 2024 & 2032
- Figure 124: Rest of Middle East and Africa Bismuth Market Revenue (Million), by Country 2024 & 2032
- Figure 125: Rest of Middle East and Africa Bismuth Market Revenue Share (%), by Country 2024 & 2032
List of Tables
- Table 1: Global Bismuth Market Revenue Million Forecast, by Region 2019 & 2032
- Table 2: Global Bismuth Market Revenue Million Forecast, by Derivatives 2019 & 2032
- Table 3: Global Bismuth Market Revenue Million Forecast, by End-user Industry 2019 & 2032
- Table 4: Global Bismuth Market Revenue Million Forecast, by Region 2019 & 2032
- Table 5: Global Bismuth Market Revenue Million Forecast, by Country 2019 & 2032
- Table 6: China Bismuth Market Revenue (Million) Forecast, by Application 2019 & 2032
- Table 7: India Bismuth Market Revenue (Million) Forecast, by Application 2019 & 2032
- Table 8: Japan Bismuth Market Revenue (Million) Forecast, by Application 2019 & 2032
- Table 9: South Korea Bismuth Market Revenue (Million) Forecast, by Application 2019 & 2032
- Table 10: Rest of Asia Pacific Bismuth Market Revenue (Million) Forecast, by Application 2019 & 2032
- Table 11: Global Bismuth Market Revenue Million Forecast, by Country 2019 & 2032
- Table 12: United States Bismuth Market Revenue (Million) Forecast, by Application 2019 & 2032
- Table 13: Canada Bismuth Market Revenue (Million) Forecast, by Application 2019 & 2032
- Table 14: Mexico Bismuth Market Revenue (Million) Forecast, by Application 2019 & 2032
- Table 15: Global Bismuth Market Revenue Million Forecast, by Country 2019 & 2032
- Table 16: Germany Bismuth Market Revenue (Million) Forecast, by Application 2019 & 2032
- Table 17: United Kingdom Bismuth Market Revenue (Million) Forecast, by Application 2019 & 2032
- Table 18: Italy Bismuth Market Revenue (Million) Forecast, by Application 2019 & 2032
- Table 19: France Bismuth Market Revenue (Million) Forecast, by Application 2019 & 2032
- Table 20: Rest of Europe Bismuth Market Revenue (Million) Forecast, by Application 2019 & 2032
- Table 21: Global Bismuth Market Revenue Million Forecast, by Country 2019 & 2032
- Table 22: Brazil Bismuth Market Revenue (Million) Forecast, by Application 2019 & 2032
- Table 23: Argentina Bismuth Market Revenue (Million) Forecast, by Application 2019 & 2032
- Table 24: Rest of South America Bismuth Market Revenue (Million) Forecast, by Application 2019 & 2032
- Table 25: Global Bismuth Market Revenue Million Forecast, by Country 2019 & 2032
- Table 26: Saudi Arabia Bismuth Market Revenue (Million) Forecast, by Application 2019 & 2032
- Table 27: South Africa Bismuth Market Revenue (Million) Forecast, by Application 2019 & 2032
- Table 28: Rest of Middle East and Africa Bismuth Market Revenue (Million) Forecast, by Application 2019 & 2032
- Table 29: Global Bismuth Market Revenue Million Forecast, by Derivatives 2019 & 2032
- Table 30: Global Bismuth Market Revenue Million Forecast, by End-user Industry 2019 & 2032
- Table 31: Global Bismuth Market Revenue Million Forecast, by Country 2019 & 2032
- Table 32: Global Bismuth Market Revenue Million Forecast, by Derivatives 2019 & 2032
- Table 33: Global Bismuth Market Revenue Million Forecast, by End-user Industry 2019 & 2032
- Table 34: Global Bismuth Market Revenue Million Forecast, by Country 2019 & 2032
- Table 35: Global Bismuth Market Revenue Million Forecast, by Derivatives 2019 & 2032
- Table 36: Global Bismuth Market Revenue Million Forecast, by End-user Industry 2019 & 2032
- Table 37: Global Bismuth Market Revenue Million Forecast, by Country 2019 & 2032
- Table 38: Global Bismuth Market Revenue Million Forecast, by Derivatives 2019 & 2032
- Table 39: Global Bismuth Market Revenue Million Forecast, by End-user Industry 2019 & 2032
- Table 40: Global Bismuth Market Revenue Million Forecast, by Country 2019 & 2032
- Table 41: Global Bismuth Market Revenue Million Forecast, by Derivatives 2019 & 2032
- Table 42: Global Bismuth Market Revenue Million Forecast, by End-user Industry 2019 & 2032
- Table 43: Global Bismuth Market Revenue Million Forecast, by Country 2019 & 2032
- Table 44: North America Bismuth Market Revenue (Million) Forecast, by Application 2019 & 2032
- Table 45: Global Bismuth Market Revenue Million Forecast, by Derivatives 2019 & 2032
- Table 46: Global Bismuth Market Revenue Million Forecast, by End-user Industry 2019 & 2032
- Table 47: Global Bismuth Market Revenue Million Forecast, by Country 2019 & 2032
- Table 48: Global Bismuth Market Revenue Million Forecast, by Derivatives 2019 & 2032
- Table 49: Global Bismuth Market Revenue Million Forecast, by End-user Industry 2019 & 2032
- Table 50: Global Bismuth Market Revenue Million Forecast, by Country 2019 & 2032
- Table 51: Global Bismuth Market Revenue Million Forecast, by Derivatives 2019 & 2032
- Table 52: Global Bismuth Market Revenue Million Forecast, by End-user Industry 2019 & 2032
- Table 53: Global Bismuth Market Revenue Million Forecast, by Country 2019 & 2032
- Table 54: Europe Bismuth Market Revenue (Million) Forecast, by Application 2019 & 2032
- Table 55: Global Bismuth Market Revenue Million Forecast, by Derivatives 2019 & 2032
- Table 56: Global Bismuth Market Revenue Million Forecast, by End-user Industry 2019 & 2032
- Table 57: Global Bismuth Market Revenue Million Forecast, by Country 2019 & 2032
- Table 58: Global Bismuth Market Revenue Million Forecast, by Derivatives 2019 & 2032
- Table 59: Global Bismuth Market Revenue Million Forecast, by End-user Industry 2019 & 2032
- Table 60: Global Bismuth Market Revenue Million Forecast, by Country 2019 & 2032
- Table 61: Global Bismuth Market Revenue Million Forecast, by Derivatives 2019 & 2032
- Table 62: Global Bismuth Market Revenue Million Forecast, by End-user Industry 2019 & 2032
- Table 63: Global Bismuth Market Revenue Million Forecast, by Country 2019 & 2032
- Table 64: Global Bismuth Market Revenue Million Forecast, by Derivatives 2019 & 2032
- Table 65: Global Bismuth Market Revenue Million Forecast, by End-user Industry 2019 & 2032
- Table 66: Global Bismuth Market Revenue Million Forecast, by Country 2019 & 2032
- Table 67: Global Bismuth Market Revenue Million Forecast, by Derivatives 2019 & 2032
- Table 68: Global Bismuth Market Revenue Million Forecast, by End-user Industry 2019 & 2032
- Table 69: Global Bismuth Market Revenue Million Forecast, by Country 2019 & 2032
- Table 70: South America Bismuth Market Revenue (Million) Forecast, by Application 2019 & 2032
- Table 71: Global Bismuth Market Revenue Million Forecast, by Derivatives 2019 & 2032
- Table 72: Global Bismuth Market Revenue Million Forecast, by End-user Industry 2019 & 2032
- Table 73: Global Bismuth Market Revenue Million Forecast, by Country 2019 & 2032
- Table 74: Global Bismuth Market Revenue Million Forecast, by Derivatives 2019 & 2032
- Table 75: Global Bismuth Market Revenue Million Forecast, by End-user Industry 2019 & 2032
- Table 76: Global Bismuth Market Revenue Million Forecast, by Country 2019 & 2032
- Table 77: Global Bismuth Market Revenue Million Forecast, by Derivatives 2019 & 2032
- Table 78: Global Bismuth Market Revenue Million Forecast, by End-user Industry 2019 & 2032
- Table 79: Global Bismuth Market Revenue Million Forecast, by Country 2019 & 2032
- Table 80: Middle East and Africa Bismuth Market Revenue (Million) Forecast, by Application 2019 & 2032
- Table 81: Global Bismuth Market Revenue Million Forecast, by Derivatives 2019 & 2032
- Table 82: Global Bismuth Market Revenue Million Forecast, by End-user Industry 2019 & 2032
- Table 83: Global Bismuth Market Revenue Million Forecast, by Country 2019 & 2032
- Table 84: Global Bismuth Market Revenue Million Forecast, by Derivatives 2019 & 2032
- Table 85: Global Bismuth Market Revenue Million Forecast, by End-user Industry 2019 & 2032
- Table 86: Global Bismuth Market Revenue Million Forecast, by Country 2019 & 2032
- Table 87: Global Bismuth Market Revenue Million Forecast, by Derivatives 2019 & 2032
- Table 88: Global Bismuth Market Revenue Million Forecast, by End-user Industry 2019 & 2032
- Table 89: Global Bismuth Market Revenue Million Forecast, by Country 2019 & 2032
Frequently Asked Questions
1. What is the projected Compound Annual Growth Rate (CAGR) of the Bismuth Market?
The projected CAGR is approximately > 5.00%.
2. Which companies are prominent players in the Bismuth Market?
Key companies in the market include Nui Phao Mining Company Limited, 5N Plus, Merck KGaA, Hunan Shizhuyuan Nonferrous Metals Co Ltd, VIAVI Solutions Inc, BASF SE, Industrias Peñoles, Fortune Minerals, Xianyang Yuehua Bismuth Co Ltd *List Not Exhaustive, Par Pharmaceutical (Endo International plc).
3. What are the main segments of the Bismuth Market?
The market segments include Derivatives, End-user Industry.
4. Can you provide details about the market size?
The market size is estimated to be USD XX Million as of 2022.
5. What are some drivers contributing to market growth?
Growing Use of Bismuth in Automobile Industry to Protect Brake Linings; Widespread Use of Bismuth in the Pharmaceutical Industry.
6. What are the notable trends driving market growth?
Pharmaceuticals Industry to Dominate the Market.
7. Are there any restraints impacting market growth?
Harm Done to the Human Body by Working with Bismuth; Limited Use of Bismuth due to Other Cost-effective Options.
8. Can you provide examples of recent developments in the market?
March 2023: Endo International plc announced that one of their operating companies, Par Pharmaceutical, Inc., began shipping the first generic version of Allergan's Pylera® (bismuth subcitrate potassium, metronidazole, tetracycline hydrochloride) 140 mg, 125 mg and 125 mg capsules in the United States, following final approval from the U.S. Food and Drug Administration of its Abbreviated New Drug Application.
9. What pricing options are available for accessing the report?
Pricing options include single-user, multi-user, and enterprise licenses priced at USD 4750, USD 5250, and USD 8750 respectively.
10. Is the market size provided in terms of value or volume?
The market size is provided in terms of value, measured in Million.
11. Are there any specific market keywords associated with the report?
Yes, the market keyword associated with the report is "Bismuth Market," which aids in identifying and referencing the specific market segment covered.
12. How do I determine which pricing option suits my needs best?
The pricing options vary based on user requirements and access needs. Individual users may opt for single-user licenses, while businesses requiring broader access may choose multi-user or enterprise licenses for cost-effective access to the report.
13. Are there any additional resources or data provided in the Bismuth Market report?
While the report offers comprehensive insights, it's advisable to review the specific contents or supplementary materials provided to ascertain if additional resources or data are available.
14. How can I stay updated on further developments or reports in the Bismuth Market?
To stay informed about further developments, trends, and reports in the Bismuth Market, consider subscribing to industry newsletters, following relevant companies and organizations, or regularly checking reputable industry news sources and publications.
Methodology
Step 1 - Identification of Relevant Samples Size from Population Database


Step 2 - Approaches for Defining Global Market Size (Value, Volume* & Price*)

Note*: In applicable scenarios
Step 3 - Data Sources
Primary Research
- Web Analytics
- Survey Reports
- Research Institute
- Latest Research Reports
- Opinion Leaders
Secondary Research
- Annual Reports
- White Paper
- Latest Press Release
- Industry Association
- Paid Database
- Investor Presentations

Step 4 - Data Triangulation
Involves using different sources of information in order to increase the validity of a study
These sources are likely to be stakeholders in a program - participants, other researchers, program staff, other community members, and so on.
Then we put all data in single framework & apply various statistical tools to find out the dynamic on the market.
During the analysis stage, feedback from the stakeholder groups would be compared to determine areas of agreement as well as areas of divergence
