

Key Insights
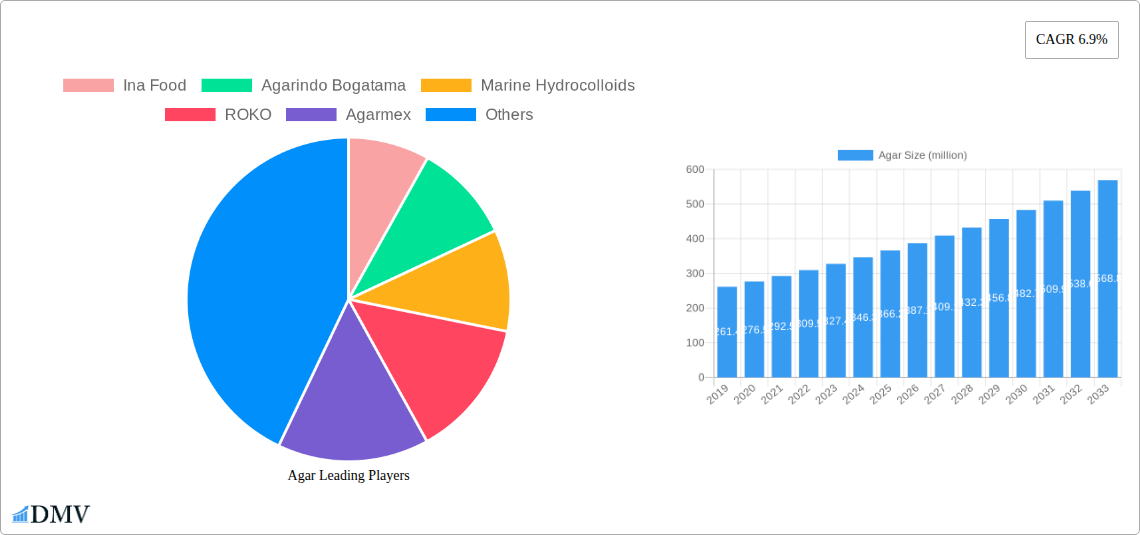
The global Agar market is poised for robust expansion, projected to reach an estimated USD 373 million in 2025 and grow at a compound annual growth rate (CAGR) of 6.9% through 2033. This sustained growth is primarily fueled by an escalating demand across diverse industrial applications, with the food industry leading the charge. The versatile properties of agar, including its gelling, stabilizing, and thickening capabilities, make it an indispensable ingredient in a wide array of food products, from desserts and confectionery to dairy alternatives and processed foods. Furthermore, the burgeoning pharmaceutical sector is a significant growth driver, leveraging agar's biocompatibility and gelling properties for culture media, drug delivery systems, and excipients. The cosmetics and daily chemical industries are also contributing to market expansion, utilizing agar for its emulsifying and thickening attributes in skincare, haircare, and personal hygiene products. Emerging applications in scientific research, particularly in microbiology and biotechnology, are further bolstering market demand.
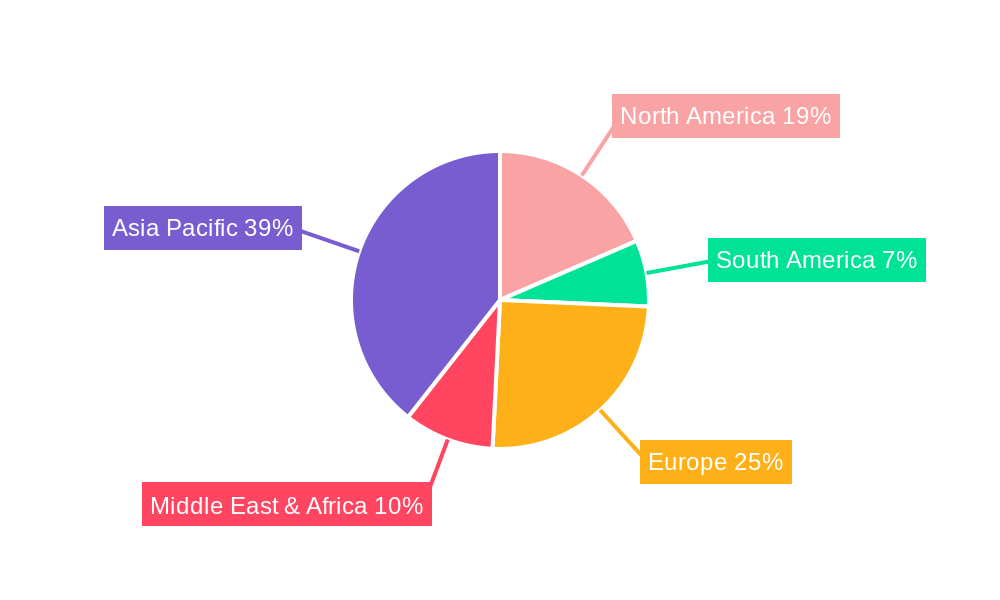
Geographically, the Asia Pacific region is expected to dominate the agar market, driven by its large population, increasing disposable incomes, and a well-established food processing industry in countries like China and India. North America and Europe also represent substantial markets, with a strong focus on premium food products and advanced pharmaceutical applications. The market is characterized by a competitive landscape with numerous established players, including Ina Food, Agarindo Bogatama, and Marine Hydrocolloids, alongside a growing number of regional manufacturers. Key trends shaping the market include the growing preference for natural and plant-based ingredients, driving demand for agar as a sustainable alternative to animal-derived gelatin. Innovations in extraction and purification technologies are also expected to improve agar quality and yield, further supporting market growth. However, the market may face challenges related to raw material price volatility and the availability of seaweed, the primary source of agar.
Comprehensive Agar Market Analysis: Trends, Forecasts, and Strategic Insights (2019-2033)
This in-depth report provides a holistic overview of the global agar market, a vital hydrocolloid with diverse applications. Spanning a study period of 2019 to 2033, with a base year of 2025 and a forecast period of 2025–2033, this analysis delves into market composition, industry evolution, regional dominance, product innovations, growth drivers, obstacles, opportunities, key players, and future strategic outlook. Leveraging high-ranking keywords such as "agar market," "hydrocolloid industry," "food grade agar," "bacteriological grade agar," "pharmaceutical applications," "cosmetic ingredients," "scientific research agar," and regional and company-specific terms, this report is optimized for maximum search visibility and stakeholder engagement.
Agar Market Composition & Trends
The agar market exhibits a moderate concentration, with leading companies such as Ina Food, Agarindo Bogatama, Marine Hydrocolloids, ROKO, Agarmex, Hispanagar, Sobigel, B&V Agar, Iberagar, Zhenpai, Agar Brasileiro, Green Fresh Group, Fujian Global Ocean Biotechnology, Qingdao Gather Great Ocean, Fujian Kingyen, Fujian Wuyi Feiyan Agar, Guandong Hizense Seaweed, Fujian Yange, Xiamen Hkay, and Putian Changde holding significant shares. Innovation catalysts include advancements in extraction technologies and the development of specialized agar grades. The regulatory landscape, particularly concerning food safety and quality standards, plays a crucial role in shaping market entry and product development. Substitute products, primarily other gelling agents like carrageenan and gelatin, present a constant competitive pressure, estimated to impact market share by approximately 10-15%. End-user profiles are diverse, ranging from large-scale food manufacturers and pharmaceutical companies to niche cosmetic brands and research institutions. Mergers and acquisitions (M&A) activities, with estimated deal values in the tens of millions of dollars, are strategic moves by key players to consolidate market position, expand product portfolios, and gain access to new geographical territories.
Agar Industry Evolution
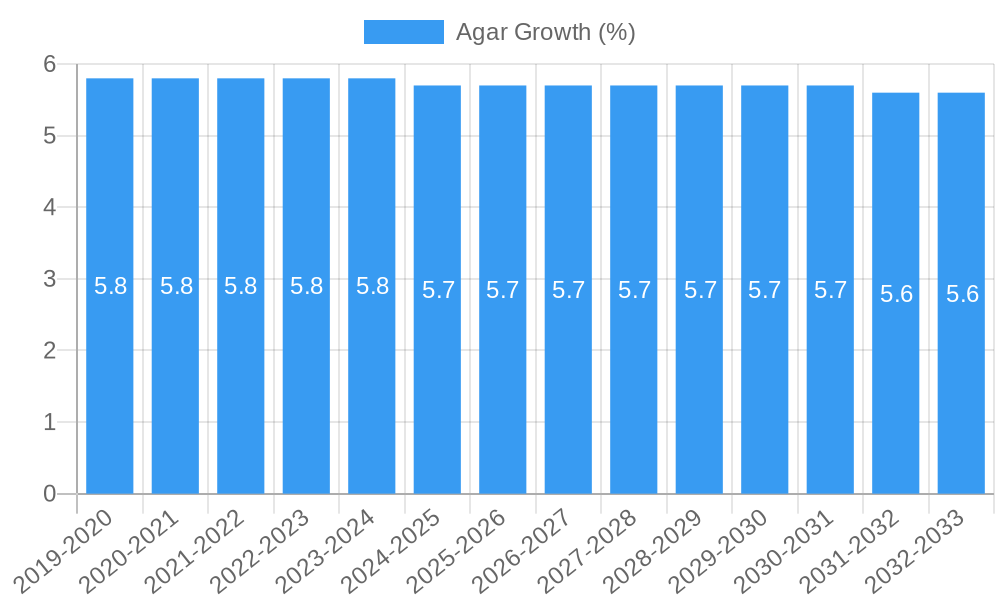
The agar industry has witnessed a consistent upward trajectory in market growth, driven by evolving consumer preferences and expanding application sectors. Over the historical period of 2019–2024, the market experienced an average annual growth rate of 4.5%, fueled by increasing demand for natural and plant-based ingredients. Technological advancements in agar extraction and purification processes have been instrumental in enhancing product quality, improving yields, and reducing production costs, thereby supporting this growth. For instance, supercritical fluid extraction methods are gaining traction, promising higher purity and reduced environmental impact. Shifting consumer demands towards healthier and more sustainable food options have significantly boosted the demand for food grade agar as a natural stabilizer, thickener, and gelling agent in a wide array of processed foods, dairy products, and desserts. The pharmaceutic sector is another significant growth engine, with bacteriological grade agar being indispensable for microbial culture media. Its unique gelling properties and inertness make it ideal for diagnostics and drug discovery. Similarly, the cosmetics and daily chemical industries are increasingly incorporating agar for its emulsifying, stabilizing, and moisturizing properties in skincare products, hair care formulations, and toothpaste. The scientific research segment continues to rely on agar for its robust performance in laboratory settings, contributing to steady demand. Overall, the agar industry evolution is characterized by a robust expansion, driven by innovation and broad-based application adoption.
Leading Regions, Countries, or Segments in Agar
The Food Industry segment, representing a substantial market share estimated at over 60%, consistently dominates the global agar market. This supremacy is attributed to the escalating demand for processed foods, confectionery, dairy products, and plant-based alternatives where agar serves as a crucial texturizing, stabilizing, and gelling agent. Consumers' growing preference for natural ingredients further bolsters agar's position in this sector.
- Key Drivers for Food Industry Dominance:
- Growing Processed Food Consumption: A rising global population and urbanization lead to increased consumption of convenient and processed food items.
- Demand for Natural & Clean Label Ingredients: Consumers are actively seeking products with fewer artificial additives, making agar a preferred choice.
- Expansion of Plant-Based Diets: The surge in vegan and vegetarian diets necessitates plant-derived ingredients like agar for texture and binding.
- Innovation in Food Formulations: Agar's versatility allows for its incorporation into a wide range of novel food products, from desserts to savory applications.
Regionally, Asia-Pacific emerges as the leading market for agar, accounting for approximately 50% of the global market share. This dominance is propelled by the region's robust food processing industry, substantial manufacturing capabilities, and significant domestic consumption.
- Dominance Factors in Asia-Pacific:
- Large Manufacturing Base: Countries like China and Southeast Asian nations are major producers and exporters of agar.
- High Population Density and Food Consumption: The sheer volume of consumers drives demand across all application segments.
- Favorable Government Policies: Supportive policies for the food and marine industries contribute to market growth.
- Cost-Effectiveness of Production: Lower operational costs in some APAC countries make agar production highly competitive.
Within the Types classification, Food Grade Agar commands the largest market share, estimated at 70%, due to its widespread use in the aforementioned food industry applications. Bacteriological Grade Agar, while representing a smaller segment (approximately 20%), is critical for the pharmaceutic and scientific research sectors, where purity and consistent gelling performance are paramount. The Cosmetics and Daily Chemical segments collectively account for the remaining market share, showcasing the expanding utility of agar beyond traditional applications.
Agar Product Innovations
Recent product innovations in the agar market focus on enhancing purity, improving gelling strength, and developing specialized grades for niche applications. Advancements in extraction techniques have led to higher clarity and lower impurity profiles, particularly for food grade agar used in desserts and beverages, ensuring superior texture and visual appeal. For the pharmaceutic and scientific research segments, innovations in bacteriological grade agar include formulations with enhanced consistency and reduced batch-to-batch variability, crucial for reproducible experimental results and diagnostic accuracy. Furthermore, research into agar derivatives with tailored rheological properties is opening new avenues in cosmetic formulations, offering novel textures and improved performance in skincare and haircare products. These advancements underscore agar's adaptability and its role as a versatile ingredient meeting evolving industry demands.
Propelling Factors for Agar Growth
The agar market is propelled by several interconnected factors. Technologically, advancements in extraction and purification processes are leading to higher quality agar with enhanced functional properties, catering to stringent industry standards. Economically, the increasing global demand for natural, plant-based ingredients in the food industry, coupled with rising disposable incomes in emerging economies, fuels market expansion. Regulatory support for food safety and the approval of agar as a safe food additive in numerous countries further bolster its market penetration. The growing popularity of vegan and vegetarian diets also acts as a significant catalyst, as agar is a key plant-derived hydrocolloid.
Obstacles in the Agar Market
Despite its growth potential, the agar market faces several obstacles. Regulatory challenges, including varying standards for purity and labeling across different regions, can create complexities for global manufacturers. Supply chain disruptions, stemming from factors like climate change affecting seaweed cultivation and geopolitical instability impacting raw material sourcing, can lead to price volatility and availability issues. Competitive pressures from substitute hydrocolloids like carrageenan and pectin, which may offer cost advantages or different functional properties, also pose a restraint. Furthermore, the labor-intensive nature of traditional agar extraction can limit scalability and impact production costs.
Future Opportunities in Agar
Emerging opportunities in the agar market are diverse and promising. The growing demand for functional foods and beverages presents a significant avenue, with agar's thickening and gelling properties being ideal for these applications. The expansion of the cosmetics and personal care industries, particularly in the realm of natural and sustainable products, offers new markets for agar-based ingredients. Innovations in bio-based materials and biodegradable packaging also present potential applications for agar. Furthermore, advancements in genetically modified seaweed or improved cultivation techniques could lead to more sustainable and cost-effective raw material sourcing, opening up new geographical markets and application segments.
Major Players in the Agar Ecosystem
- Ina Food
- Agarindo Bogatama
- Marine Hydrocolloids
- ROKO
- Agarmex
- Hispanagar
- Sobigel
- B&V Agar
- Iberagar
- Zhenpai
- Agar Brasileiro
- Green Fresh Group
- Fujian Global Ocean Biotechnology
- Qingdao Gather Great Ocean
- Fujian Kingyen
- Fujian Wuyi Feiyan Agar
- Guandong Hizense Seaweed
- Fujian Yange
- Xiamen Hkay
- Putian Changde
Key Developments in Agar Industry
- 2023 (Ongoing): Increased focus on sustainable seaweed farming practices and ethical sourcing across major producing regions.
- 2023 March: Launch of new high-purity bacteriological grade agar formulations by several key players for advanced cell culture applications.
- 2022 December: Several companies report successful integration of advanced filtration technologies to improve agar clarity and yield.
- 2022 July: Emergence of novel agar blends with tailored textural properties for plant-based meat and dairy alternatives.
- 2021 November: Expansion of production capacities for food-grade agar in Southeast Asia to meet growing global demand.
- 2021 May: Significant investment in R&D for agar derivatives with enhanced emulsifying and stabilizing capabilities for cosmetic applications.
Strategic Agar Market Forecast
The strategic agar market forecast indicates continued robust growth, driven by the confluence of increasing demand for natural ingredients, technological advancements, and expanding application diversity. The food industry will remain the primary demand driver, with innovations in plant-based products and clean-label formulations creating sustained opportunities. The pharmaceutic and scientific research sectors will continue to rely on high-purity agar, while the cosmetics and daily chemical industries present burgeoning avenues for growth. Emerging markets, coupled with a global shift towards sustainable and bio-based solutions, position the agar market for a promising future characterized by innovation and broad-based adoption.
Agar Segmentation
-
1. Application
- 1.1. Food Industry
- 1.2. Pharmaceutic
- 1.3. Cosmetics
- 1.4. Daily Chemical
- 1.5. Scientific Research
-
2. Types
- 2.1. Food Grade
- 2.2. Bacteriological Grade
Agar Segmentation By Geography
-
1. North America
- 1.1. United States
- 1.2. Canada
- 1.3. Mexico
-
2. South America
- 2.1. Brazil
- 2.2. Argentina
- 2.3. Rest of South America
-
3. Europe
- 3.1. United Kingdom
- 3.2. Germany
- 3.3. France
- 3.4. Italy
- 3.5. Spain
- 3.6. Russia
- 3.7. Benelux
- 3.8. Nordics
- 3.9. Rest of Europe
-
4. Middle East & Africa
- 4.1. Turkey
- 4.2. Israel
- 4.3. GCC
- 4.4. North Africa
- 4.5. South Africa
- 4.6. Rest of Middle East & Africa
-
5. Asia Pacific
- 5.1. China
- 5.2. India
- 5.3. Japan
- 5.4. South Korea
- 5.5. ASEAN
- 5.6. Oceania
- 5.7. Rest of Asia Pacific
Agar REPORT HIGHLIGHTS
| Aspects | Details |
|---|---|
| Study Period | 2019-2033 |
| Base Year | 2024 |
| Estimated Year | 2025 |
| Forecast Period | 2025-2033 |
| Historical Period | 2019-2024 |
| Growth Rate | CAGR of 6.9% from 2019-2033 |
| Segmentation |
|
Table of Contents
- 1. Introduction
- 1.1. Research Scope
- 1.2. Market Segmentation
- 1.3. Research Methodology
- 1.4. Definitions and Assumptions
- 2. Executive Summary
- 2.1. Introduction
- 3. Market Dynamics
- 3.1. Introduction
- 3.2. Market Drivers
- 3.3. Market Restrains
- 3.4. Market Trends
- 4. Market Factor Analysis
- 4.1. Porters Five Forces
- 4.2. Supply/Value Chain
- 4.3. PESTEL analysis
- 4.4. Market Entropy
- 4.5. Patent/Trademark Analysis
- 5. Global Agar Analysis, Insights and Forecast, 2019-2031
- 5.1. Market Analysis, Insights and Forecast - by Application
- 5.1.1. Food Industry
- 5.1.2. Pharmaceutic
- 5.1.3. Cosmetics
- 5.1.4. Daily Chemical
- 5.1.5. Scientific Research
- 5.2. Market Analysis, Insights and Forecast - by Types
- 5.2.1. Food Grade
- 5.2.2. Bacteriological Grade
- 5.3. Market Analysis, Insights and Forecast - by Region
- 5.3.1. North America
- 5.3.2. South America
- 5.3.3. Europe
- 5.3.4. Middle East & Africa
- 5.3.5. Asia Pacific
- 5.1. Market Analysis, Insights and Forecast - by Application
- 6. North America Agar Analysis, Insights and Forecast, 2019-2031
- 6.1. Market Analysis, Insights and Forecast - by Application
- 6.1.1. Food Industry
- 6.1.2. Pharmaceutic
- 6.1.3. Cosmetics
- 6.1.4. Daily Chemical
- 6.1.5. Scientific Research
- 6.2. Market Analysis, Insights and Forecast - by Types
- 6.2.1. Food Grade
- 6.2.2. Bacteriological Grade
- 6.1. Market Analysis, Insights and Forecast - by Application
- 7. South America Agar Analysis, Insights and Forecast, 2019-2031
- 7.1. Market Analysis, Insights and Forecast - by Application
- 7.1.1. Food Industry
- 7.1.2. Pharmaceutic
- 7.1.3. Cosmetics
- 7.1.4. Daily Chemical
- 7.1.5. Scientific Research
- 7.2. Market Analysis, Insights and Forecast - by Types
- 7.2.1. Food Grade
- 7.2.2. Bacteriological Grade
- 7.1. Market Analysis, Insights and Forecast - by Application
- 8. Europe Agar Analysis, Insights and Forecast, 2019-2031
- 8.1. Market Analysis, Insights and Forecast - by Application
- 8.1.1. Food Industry
- 8.1.2. Pharmaceutic
- 8.1.3. Cosmetics
- 8.1.4. Daily Chemical
- 8.1.5. Scientific Research
- 8.2. Market Analysis, Insights and Forecast - by Types
- 8.2.1. Food Grade
- 8.2.2. Bacteriological Grade
- 8.1. Market Analysis, Insights and Forecast - by Application
- 9. Middle East & Africa Agar Analysis, Insights and Forecast, 2019-2031
- 9.1. Market Analysis, Insights and Forecast - by Application
- 9.1.1. Food Industry
- 9.1.2. Pharmaceutic
- 9.1.3. Cosmetics
- 9.1.4. Daily Chemical
- 9.1.5. Scientific Research
- 9.2. Market Analysis, Insights and Forecast - by Types
- 9.2.1. Food Grade
- 9.2.2. Bacteriological Grade
- 9.1. Market Analysis, Insights and Forecast - by Application
- 10. Asia Pacific Agar Analysis, Insights and Forecast, 2019-2031
- 10.1. Market Analysis, Insights and Forecast - by Application
- 10.1.1. Food Industry
- 10.1.2. Pharmaceutic
- 10.1.3. Cosmetics
- 10.1.4. Daily Chemical
- 10.1.5. Scientific Research
- 10.2. Market Analysis, Insights and Forecast - by Types
- 10.2.1. Food Grade
- 10.2.2. Bacteriological Grade
- 10.1. Market Analysis, Insights and Forecast - by Application
- 11. Competitive Analysis
- 11.1. Global Market Share Analysis 2024
- 11.2. Company Profiles
- 11.2.1 Ina Food
- 11.2.1.1. Overview
- 11.2.1.2. Products
- 11.2.1.3. SWOT Analysis
- 11.2.1.4. Recent Developments
- 11.2.1.5. Financials (Based on Availability)
- 11.2.2 Agarindo Bogatama
- 11.2.2.1. Overview
- 11.2.2.2. Products
- 11.2.2.3. SWOT Analysis
- 11.2.2.4. Recent Developments
- 11.2.2.5. Financials (Based on Availability)
- 11.2.3 Marine Hydrocolloids
- 11.2.3.1. Overview
- 11.2.3.2. Products
- 11.2.3.3. SWOT Analysis
- 11.2.3.4. Recent Developments
- 11.2.3.5. Financials (Based on Availability)
- 11.2.4 ROKO
- 11.2.4.1. Overview
- 11.2.4.2. Products
- 11.2.4.3. SWOT Analysis
- 11.2.4.4. Recent Developments
- 11.2.4.5. Financials (Based on Availability)
- 11.2.5 Agarmex
- 11.2.5.1. Overview
- 11.2.5.2. Products
- 11.2.5.3. SWOT Analysis
- 11.2.5.4. Recent Developments
- 11.2.5.5. Financials (Based on Availability)
- 11.2.6 Hispanagar
- 11.2.6.1. Overview
- 11.2.6.2. Products
- 11.2.6.3. SWOT Analysis
- 11.2.6.4. Recent Developments
- 11.2.6.5. Financials (Based on Availability)
- 11.2.7 Sobigel
- 11.2.7.1. Overview
- 11.2.7.2. Products
- 11.2.7.3. SWOT Analysis
- 11.2.7.4. Recent Developments
- 11.2.7.5. Financials (Based on Availability)
- 11.2.8 B&V Agar
- 11.2.8.1. Overview
- 11.2.8.2. Products
- 11.2.8.3. SWOT Analysis
- 11.2.8.4. Recent Developments
- 11.2.8.5. Financials (Based on Availability)
- 11.2.9 Iberagar
- 11.2.9.1. Overview
- 11.2.9.2. Products
- 11.2.9.3. SWOT Analysis
- 11.2.9.4. Recent Developments
- 11.2.9.5. Financials (Based on Availability)
- 11.2.10 Zhenpai
- 11.2.10.1. Overview
- 11.2.10.2. Products
- 11.2.10.3. SWOT Analysis
- 11.2.10.4. Recent Developments
- 11.2.10.5. Financials (Based on Availability)
- 11.2.11 Agar Brasileiro
- 11.2.11.1. Overview
- 11.2.11.2. Products
- 11.2.11.3. SWOT Analysis
- 11.2.11.4. Recent Developments
- 11.2.11.5. Financials (Based on Availability)
- 11.2.12 Green Fresh Group
- 11.2.12.1. Overview
- 11.2.12.2. Products
- 11.2.12.3. SWOT Analysis
- 11.2.12.4. Recent Developments
- 11.2.12.5. Financials (Based on Availability)
- 11.2.13 Fujian Global Ocean Biotechnology
- 11.2.13.1. Overview
- 11.2.13.2. Products
- 11.2.13.3. SWOT Analysis
- 11.2.13.4. Recent Developments
- 11.2.13.5. Financials (Based on Availability)
- 11.2.14 Qingdao Gather Great Ocean
- 11.2.14.1. Overview
- 11.2.14.2. Products
- 11.2.14.3. SWOT Analysis
- 11.2.14.4. Recent Developments
- 11.2.14.5. Financials (Based on Availability)
- 11.2.15 Fujian Kingyen
- 11.2.15.1. Overview
- 11.2.15.2. Products
- 11.2.15.3. SWOT Analysis
- 11.2.15.4. Recent Developments
- 11.2.15.5. Financials (Based on Availability)
- 11.2.16 Fujian Wuyi Feiyan Agar
- 11.2.16.1. Overview
- 11.2.16.2. Products
- 11.2.16.3. SWOT Analysis
- 11.2.16.4. Recent Developments
- 11.2.16.5. Financials (Based on Availability)
- 11.2.17 Guandong Hizense Seaweed
- 11.2.17.1. Overview
- 11.2.17.2. Products
- 11.2.17.3. SWOT Analysis
- 11.2.17.4. Recent Developments
- 11.2.17.5. Financials (Based on Availability)
- 11.2.18 Fujian Yange
- 11.2.18.1. Overview
- 11.2.18.2. Products
- 11.2.18.3. SWOT Analysis
- 11.2.18.4. Recent Developments
- 11.2.18.5. Financials (Based on Availability)
- 11.2.19 Xiamen Hkay
- 11.2.19.1. Overview
- 11.2.19.2. Products
- 11.2.19.3. SWOT Analysis
- 11.2.19.4. Recent Developments
- 11.2.19.5. Financials (Based on Availability)
- 11.2.20 Putian Changde
- 11.2.20.1. Overview
- 11.2.20.2. Products
- 11.2.20.3. SWOT Analysis
- 11.2.20.4. Recent Developments
- 11.2.20.5. Financials (Based on Availability)
- 11.2.1 Ina Food
List of Figures
- Figure 1: Global Agar Revenue Breakdown (million, %) by Region 2024 & 2032
- Figure 2: North America Agar Revenue (million), by Application 2024 & 2032
- Figure 3: North America Agar Revenue Share (%), by Application 2024 & 2032
- Figure 4: North America Agar Revenue (million), by Types 2024 & 2032
- Figure 5: North America Agar Revenue Share (%), by Types 2024 & 2032
- Figure 6: North America Agar Revenue (million), by Country 2024 & 2032
- Figure 7: North America Agar Revenue Share (%), by Country 2024 & 2032
- Figure 8: South America Agar Revenue (million), by Application 2024 & 2032
- Figure 9: South America Agar Revenue Share (%), by Application 2024 & 2032
- Figure 10: South America Agar Revenue (million), by Types 2024 & 2032
- Figure 11: South America Agar Revenue Share (%), by Types 2024 & 2032
- Figure 12: South America Agar Revenue (million), by Country 2024 & 2032
- Figure 13: South America Agar Revenue Share (%), by Country 2024 & 2032
- Figure 14: Europe Agar Revenue (million), by Application 2024 & 2032
- Figure 15: Europe Agar Revenue Share (%), by Application 2024 & 2032
- Figure 16: Europe Agar Revenue (million), by Types 2024 & 2032
- Figure 17: Europe Agar Revenue Share (%), by Types 2024 & 2032
- Figure 18: Europe Agar Revenue (million), by Country 2024 & 2032
- Figure 19: Europe Agar Revenue Share (%), by Country 2024 & 2032
- Figure 20: Middle East & Africa Agar Revenue (million), by Application 2024 & 2032
- Figure 21: Middle East & Africa Agar Revenue Share (%), by Application 2024 & 2032
- Figure 22: Middle East & Africa Agar Revenue (million), by Types 2024 & 2032
- Figure 23: Middle East & Africa Agar Revenue Share (%), by Types 2024 & 2032
- Figure 24: Middle East & Africa Agar Revenue (million), by Country 2024 & 2032
- Figure 25: Middle East & Africa Agar Revenue Share (%), by Country 2024 & 2032
- Figure 26: Asia Pacific Agar Revenue (million), by Application 2024 & 2032
- Figure 27: Asia Pacific Agar Revenue Share (%), by Application 2024 & 2032
- Figure 28: Asia Pacific Agar Revenue (million), by Types 2024 & 2032
- Figure 29: Asia Pacific Agar Revenue Share (%), by Types 2024 & 2032
- Figure 30: Asia Pacific Agar Revenue (million), by Country 2024 & 2032
- Figure 31: Asia Pacific Agar Revenue Share (%), by Country 2024 & 2032
List of Tables
- Table 1: Global Agar Revenue million Forecast, by Region 2019 & 2032
- Table 2: Global Agar Revenue million Forecast, by Application 2019 & 2032
- Table 3: Global Agar Revenue million Forecast, by Types 2019 & 2032
- Table 4: Global Agar Revenue million Forecast, by Region 2019 & 2032
- Table 5: Global Agar Revenue million Forecast, by Application 2019 & 2032
- Table 6: Global Agar Revenue million Forecast, by Types 2019 & 2032
- Table 7: Global Agar Revenue million Forecast, by Country 2019 & 2032
- Table 8: United States Agar Revenue (million) Forecast, by Application 2019 & 2032
- Table 9: Canada Agar Revenue (million) Forecast, by Application 2019 & 2032
- Table 10: Mexico Agar Revenue (million) Forecast, by Application 2019 & 2032
- Table 11: Global Agar Revenue million Forecast, by Application 2019 & 2032
- Table 12: Global Agar Revenue million Forecast, by Types 2019 & 2032
- Table 13: Global Agar Revenue million Forecast, by Country 2019 & 2032
- Table 14: Brazil Agar Revenue (million) Forecast, by Application 2019 & 2032
- Table 15: Argentina Agar Revenue (million) Forecast, by Application 2019 & 2032
- Table 16: Rest of South America Agar Revenue (million) Forecast, by Application 2019 & 2032
- Table 17: Global Agar Revenue million Forecast, by Application 2019 & 2032
- Table 18: Global Agar Revenue million Forecast, by Types 2019 & 2032
- Table 19: Global Agar Revenue million Forecast, by Country 2019 & 2032
- Table 20: United Kingdom Agar Revenue (million) Forecast, by Application 2019 & 2032
- Table 21: Germany Agar Revenue (million) Forecast, by Application 2019 & 2032
- Table 22: France Agar Revenue (million) Forecast, by Application 2019 & 2032
- Table 23: Italy Agar Revenue (million) Forecast, by Application 2019 & 2032
- Table 24: Spain Agar Revenue (million) Forecast, by Application 2019 & 2032
- Table 25: Russia Agar Revenue (million) Forecast, by Application 2019 & 2032
- Table 26: Benelux Agar Revenue (million) Forecast, by Application 2019 & 2032
- Table 27: Nordics Agar Revenue (million) Forecast, by Application 2019 & 2032
- Table 28: Rest of Europe Agar Revenue (million) Forecast, by Application 2019 & 2032
- Table 29: Global Agar Revenue million Forecast, by Application 2019 & 2032
- Table 30: Global Agar Revenue million Forecast, by Types 2019 & 2032
- Table 31: Global Agar Revenue million Forecast, by Country 2019 & 2032
- Table 32: Turkey Agar Revenue (million) Forecast, by Application 2019 & 2032
- Table 33: Israel Agar Revenue (million) Forecast, by Application 2019 & 2032
- Table 34: GCC Agar Revenue (million) Forecast, by Application 2019 & 2032
- Table 35: North Africa Agar Revenue (million) Forecast, by Application 2019 & 2032
- Table 36: South Africa Agar Revenue (million) Forecast, by Application 2019 & 2032
- Table 37: Rest of Middle East & Africa Agar Revenue (million) Forecast, by Application 2019 & 2032
- Table 38: Global Agar Revenue million Forecast, by Application 2019 & 2032
- Table 39: Global Agar Revenue million Forecast, by Types 2019 & 2032
- Table 40: Global Agar Revenue million Forecast, by Country 2019 & 2032
- Table 41: China Agar Revenue (million) Forecast, by Application 2019 & 2032
- Table 42: India Agar Revenue (million) Forecast, by Application 2019 & 2032
- Table 43: Japan Agar Revenue (million) Forecast, by Application 2019 & 2032
- Table 44: South Korea Agar Revenue (million) Forecast, by Application 2019 & 2032
- Table 45: ASEAN Agar Revenue (million) Forecast, by Application 2019 & 2032
- Table 46: Oceania Agar Revenue (million) Forecast, by Application 2019 & 2032
- Table 47: Rest of Asia Pacific Agar Revenue (million) Forecast, by Application 2019 & 2032
Frequently Asked Questions
1. What is the projected Compound Annual Growth Rate (CAGR) of the Agar?
The projected CAGR is approximately 6.9%.
2. Which companies are prominent players in the Agar?
Key companies in the market include Ina Food, Agarindo Bogatama, Marine Hydrocolloids, ROKO, Agarmex, Hispanagar, Sobigel, B&V Agar, Iberagar, Zhenpai, Agar Brasileiro, Green Fresh Group, Fujian Global Ocean Biotechnology, Qingdao Gather Great Ocean, Fujian Kingyen, Fujian Wuyi Feiyan Agar, Guandong Hizense Seaweed, Fujian Yange, Xiamen Hkay, Putian Changde.
3. What are the main segments of the Agar?
The market segments include Application, Types.
4. Can you provide details about the market size?
The market size is estimated to be USD 373 million as of 2022.
5. What are some drivers contributing to market growth?
N/A
6. What are the notable trends driving market growth?
N/A
7. Are there any restraints impacting market growth?
N/A
8. Can you provide examples of recent developments in the market?
N/A
9. What pricing options are available for accessing the report?
Pricing options include single-user, multi-user, and enterprise licenses priced at USD 5900.00, USD 8850.00, and USD 11800.00 respectively.
10. Is the market size provided in terms of value or volume?
The market size is provided in terms of value, measured in million.
11. Are there any specific market keywords associated with the report?
Yes, the market keyword associated with the report is "Agar," which aids in identifying and referencing the specific market segment covered.
12. How do I determine which pricing option suits my needs best?
The pricing options vary based on user requirements and access needs. Individual users may opt for single-user licenses, while businesses requiring broader access may choose multi-user or enterprise licenses for cost-effective access to the report.
13. Are there any additional resources or data provided in the Agar report?
While the report offers comprehensive insights, it's advisable to review the specific contents or supplementary materials provided to ascertain if additional resources or data are available.
14. How can I stay updated on further developments or reports in the Agar?
To stay informed about further developments, trends, and reports in the Agar, consider subscribing to industry newsletters, following relevant companies and organizations, or regularly checking reputable industry news sources and publications.
Methodology
Step 1 - Identification of Relevant Samples Size from Population Database


Step 2 - Approaches for Defining Global Market Size (Value, Volume* & Price*)

Note*: In applicable scenarios
Step 3 - Data Sources
Primary Research
- Web Analytics
- Survey Reports
- Research Institute
- Latest Research Reports
- Opinion Leaders
Secondary Research
- Annual Reports
- White Paper
- Latest Press Release
- Industry Association
- Paid Database
- Investor Presentations

Step 4 - Data Triangulation
Involves using different sources of information in order to increase the validity of a study
These sources are likely to be stakeholders in a program - participants, other researchers, program staff, other community members, and so on.
Then we put all data in single framework & apply various statistical tools to find out the dynamic on the market.
During the analysis stage, feedback from the stakeholder groups would be compared to determine areas of agreement as well as areas of divergence
