

Key Insights
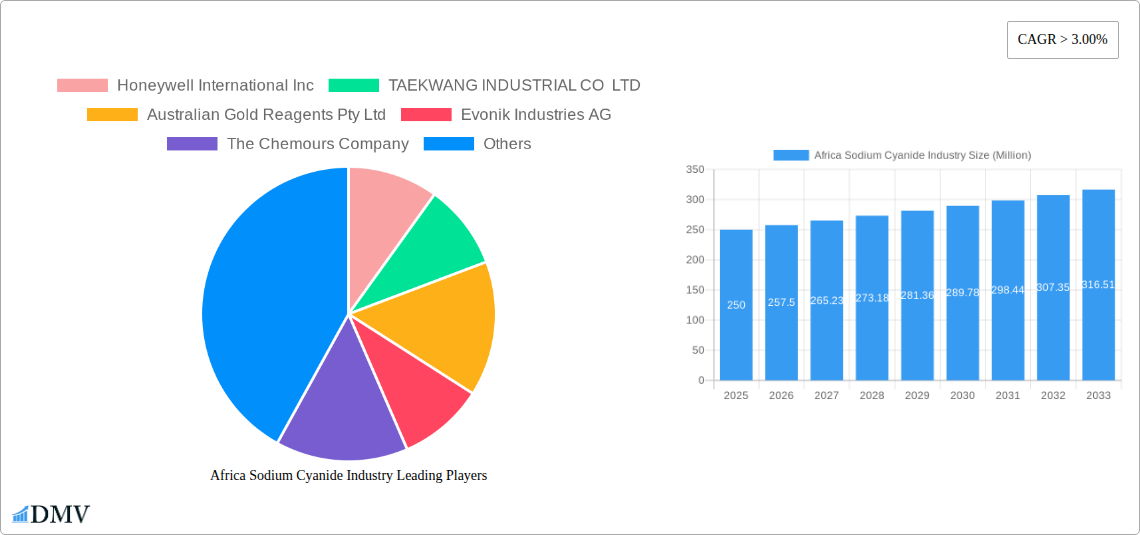
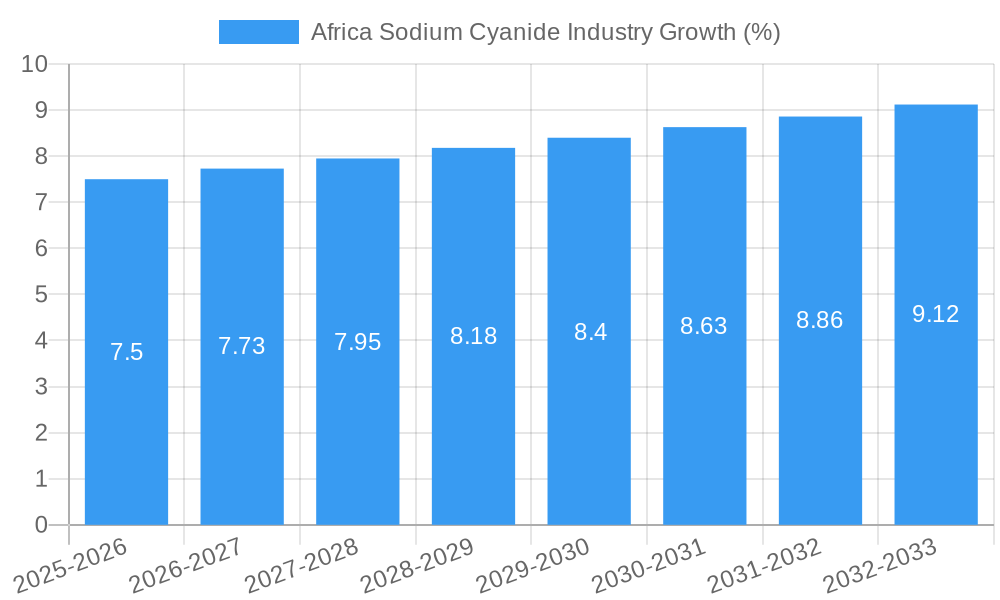
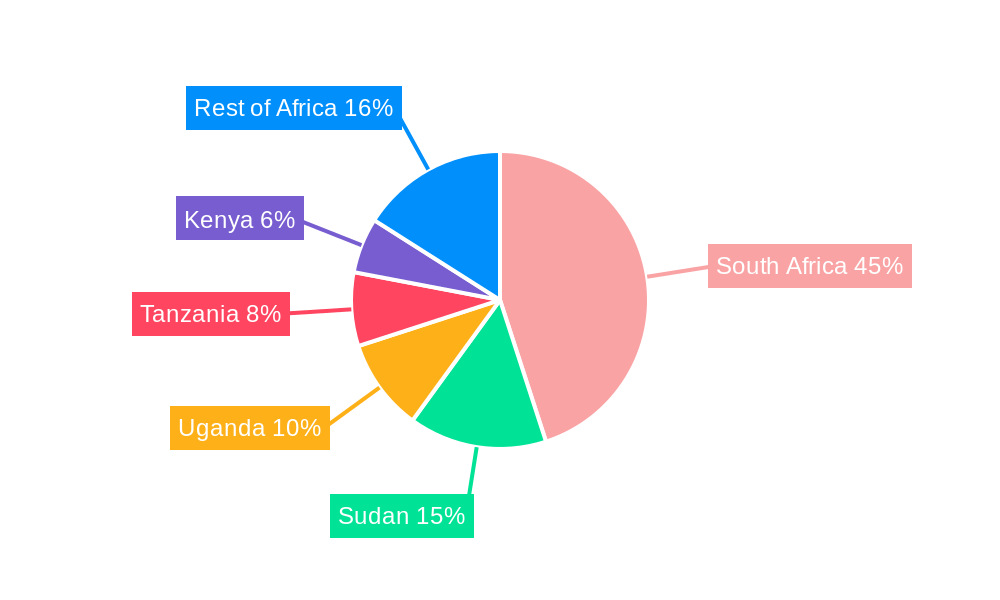
The African sodium cyanide market, valued at approximately $250 million in 2025, is projected to experience robust growth, exceeding a 3% compound annual growth rate (CAGR) through 2033. This expansion is primarily driven by the burgeoning mining sector, particularly gold mining, across several African nations. South Africa, with its established gold mining industry, currently dominates the market, followed by other significant producers such as Sudan, Uganda, and Tanzania. Increased gold exploration and the development of new mining projects are fueling demand for sodium cyanide, a crucial reagent in gold extraction. Furthermore, the rising adoption of efficient and environmentally friendly cyanide management techniques within the mining industry contributes positively to market growth. However, stringent environmental regulations concerning cyanide handling and disposal pose a significant restraint. Fluctuations in gold prices also impact market dynamics, influencing the profitability of mining operations and subsequently the demand for sodium cyanide. The chemical industry, a smaller segment, utilizes sodium cyanide for various applications, although its contribution to overall market growth is comparatively less significant than the mining sector. Major players such as Honeywell International Inc., Evonik Industries AG, and Orica Limited are actively competing in this market, striving to improve product quality, optimize supply chains, and explore innovative cyanide management solutions.
The forecast period (2025-2033) anticipates continued market growth, primarily fuelled by consistent gold production increases and ongoing investments in mining infrastructure across the region. Emerging markets in East Africa, including Kenya and Uganda, are expected to contribute increasingly to the overall market size over the coming years, further diversifying the regional demand profile. However, potential risks include fluctuations in gold prices and the intensifying focus on sustainable mining practices, necessitating continuous innovation in cyanide handling and waste management technologies to ensure long-term market stability. The competitive landscape is expected to remain dynamic with existing players and potential new entrants vying for market share through strategic alliances, technological advancements, and enhanced service offerings.
This comprehensive report provides an in-depth analysis of the Africa sodium cyanide industry, offering invaluable insights for stakeholders seeking to navigate this dynamic market. Covering the period from 2019 to 2033, with a focus on 2025, this report forecasts market trends, identifies key players, and highlights growth opportunities. The study period spans 2019–2024 (Historical Period), 2025 (Base Year & Estimated Year), and 2025–2033 (Forecast Period). Millions are used for all value estimations.
Africa Sodium Cyanide Industry Market Composition & Trends
This section delves into the competitive landscape of the African sodium cyanide market, examining market concentration, innovation drivers, regulatory frameworks, substitute products, end-user profiles, and mergers & acquisitions (M&A) activities. The report meticulously analyzes market share distribution across key players, estimating their respective contributions to the overall market value. For example, the market share of Honeywell International Inc. in 2025 is estimated to be xx%, while that of Sasol is estimated at yy%. Detailed analysis of M&A activities includes deal values and their impact on market dynamics. The report considers the influence of regulatory changes on market access and competitiveness, assessing the impact of varying regulations across different African nations. Substitute product analysis explores potential alternatives to sodium cyanide and their market penetration, highlighting any competitive threats they pose. Finally, end-user profiles examine the diverse applications of sodium cyanide across mining, chemical, and other industries, quantifying the demand from each segment.
- Market Concentration: Highly concentrated market with top 5 players holding xx% market share in 2025.
- Innovation Catalysts: Focus on improving efficiency, reducing environmental impact, and developing safer handling processes.
- Regulatory Landscape: Varied regulatory environments across African nations, impacting market access and operational costs.
- Substitute Products: Limited effective substitutes, but research into alternative lixiviants is ongoing.
- End-User Profiles: Mining dominates the market (xx%), followed by the chemical industry (yy%) and other end-user industries (zz%).
- M&A Activities: A total of xx M&A deals valued at approximately $xxx Million were recorded between 2019 and 2024.
Africa Sodium Cyanide Industry Industry Evolution
This section provides a detailed account of the evolution of the African sodium cyanide industry, tracing its growth trajectory from 2019 to 2033. The analysis encompasses technological advancements that have shaped the industry, along with an evaluation of shifting consumer demands and their influence on market dynamics. The report highlights significant growth rates experienced over the historical period and projects future growth, considering factors like technological innovations, evolving regulatory landscapes, and shifts in end-user preferences. For instance, the market is projected to grow at a CAGR of xx% during the forecast period (2025-2033), reaching a market value of $xxx Million by 2033. Key technological developments, such as improved extraction methods and safer handling techniques, are assessed for their impact on industry efficiency and growth.
Leading Regions, Countries, or Segments in Africa Sodium Cyanide Industry
This section pinpoints the leading regions, countries, and segments within the African sodium cyanide market, providing a granular examination of their dominance. The analysis focuses on three primary end-user industries: Mining, Chemical, and Other End-user Industries. South Africa is identified as the leading market due to its established mining sector and well-developed infrastructure, followed by other significant players such as Tanzania, Ghana, and Mali. The report examines factors driving the dominance of these regions, such as investment trends, regulatory support, and resource availability. For example, South Africa's robust mining sector, coupled with government support for mineral exploration and processing, fuels its leadership in the market.
- Key Drivers for South Africa's Dominance:
- Significant gold and other precious metal reserves.
- Well-established mining infrastructure and expertise.
- Supportive government policies and investment incentives.
- Strong local supply chain for related services and materials.
Africa Sodium Cyanide Industry Product Innovations
This section explores recent product innovations in the African sodium cyanide market, highlighting advancements in formulation, performance, and application. The report focuses on unique selling propositions (USPs) that differentiate products and enhance their appeal to end-users. These innovations often address concerns related to safety, environmental impact, and efficiency in cyanide use within mining processes. The analysis includes metrics showcasing performance improvements (e.g., increased extraction rates, reduced consumption).
Propelling Factors for Africa Sodium Cyanide Industry Growth
Several key factors are driving growth in the African sodium cyanide industry. Technological advancements, particularly in extraction techniques and handling processes, are improving efficiency and reducing environmental risks. Economic growth across several African nations, coupled with increased investment in the mining sector, is boosting demand for sodium cyanide. Finally, favorable government policies and regulations are creating a supportive environment for industry growth.
Obstacles in the Africa Sodium Cyanide Industry Market
The African sodium cyanide industry faces various challenges. Stringent environmental regulations can increase operational costs and compliance complexities. Supply chain disruptions, particularly during periods of geopolitical instability, can impact availability and pricing. Furthermore, intense competition from established players and the potential emergence of new entrants create pressure on margins and market share. The total estimated impact of these obstacles on the market value in 2025 is estimated to be $xx Million.
Future Opportunities in Africa Sodium Cyanide Industry
The African sodium cyanide market presents several promising opportunities. Expanding mining activities across the continent, driven by rising demand for precious metals, will increase market size. The development of more sustainable and environmentally friendly cyanide handling and disposal methods will create new market segments. Finally, the growing adoption of advanced technologies in mining operations will further enhance efficiency and demand for optimized cyanide formulations.
Major Players in the Africa Sodium Cyanide Industry Ecosystem
- Honeywell International Inc
- TAEKWANG INDUSTRIAL CO LTD
- Australian Gold Reagents Pty Ltd
- Evonik Industries AG
- The Chemours Company
- Sasol
- HeBei ChengXin
- TSPC
- Orica Limited
Key Developments in Africa Sodium Cyanide Industry Industry
- April 2022: Australian Gold Reagents (AGR) announced plans to expand its sodium cyanide production capacity by 30,000 tons per annum, increasing its total output to over 120,000 tons annually. This expansion aims to meet growing global demand, with a significant portion allocated to African markets.
- January 2023: Shortages of sodium cyanide in Tanzania significantly hampered the operations of large and medium-scale miners, highlighting the vulnerability of the industry to supply chain disruptions.
Strategic Africa Sodium Cyanide Industry Market Forecast
The African sodium cyanide market is poised for robust growth, driven by increasing gold mining activity, coupled with the expansion of other end-user industries. Ongoing technological advancements and supportive government policies will further accelerate market expansion. The market's projected growth trajectory signifies substantial opportunities for industry players to capitalize on the rising demand and expand their market presence in this dynamic region. The forecast anticipates a sustained growth pattern, leading to a significant increase in market value over the coming years.
Africa Sodium Cyanide Industry Segmentation
-
1. End-user Industry
- 1.1. Mining
- 1.2. Chemical
- 1.3. Other End-user Industries
Africa Sodium Cyanide Industry Segmentation By Geography
- 1. Ghana
- 2. Burkina Faso
- 3. Egypt
- 4. Tanzania
- 5. Zimbabwe
- 6. Mali
- 7. Democratic Republic of Congo
- 8. Sudan
- 9. Guinea
- 10. South Africa
- 11. Rest of Africa
Africa Sodium Cyanide Industry REPORT HIGHLIGHTS
| Aspects | Details |
|---|---|
| Study Period | 2019-2033 |
| Base Year | 2024 |
| Estimated Year | 2025 |
| Forecast Period | 2025-2033 |
| Historical Period | 2019-2024 |
| Growth Rate | CAGR of > 3.00% from 2019-2033 |
| Segmentation |
|
Table of Contents
- 1. Introduction
- 1.1. Research Scope
- 1.2. Market Segmentation
- 1.3. Research Methodology
- 1.4. Definitions and Assumptions
- 2. Executive Summary
- 2.1. Introduction
- 3. Market Dynamics
- 3.1. Introduction
- 3.2. Market Drivers
- 3.2.1. Increasing Demand from the Gold Mining Activities; Increasing Demand for Use in Chemical and Polymer Synthesis
- 3.3. Market Restrains
- 3.3.1. Toxicity of Sodium Cyanide
- 3.4. Market Trends
- 3.4.1. Increasing Demand from Mining Industry
- 4. Market Factor Analysis
- 4.1. Porters Five Forces
- 4.2. Supply/Value Chain
- 4.3. PESTEL analysis
- 4.4. Market Entropy
- 4.5. Patent/Trademark Analysis
- 5. Africa Sodium Cyanide Industry Analysis, Insights and Forecast, 2019-2031
- 5.1. Market Analysis, Insights and Forecast - by End-user Industry
- 5.1.1. Mining
- 5.1.2. Chemical
- 5.1.3. Other End-user Industries
- 5.2. Market Analysis, Insights and Forecast - by Region
- 5.2.1. Ghana
- 5.2.2. Burkina Faso
- 5.2.3. Egypt
- 5.2.4. Tanzania
- 5.2.5. Zimbabwe
- 5.2.6. Mali
- 5.2.7. Democratic Republic of Congo
- 5.2.8. Sudan
- 5.2.9. Guinea
- 5.2.10. South Africa
- 5.2.11. Rest of Africa
- 5.1. Market Analysis, Insights and Forecast - by End-user Industry
- 6. Ghana Africa Sodium Cyanide Industry Analysis, Insights and Forecast, 2019-2031
- 6.1. Market Analysis, Insights and Forecast - by End-user Industry
- 6.1.1. Mining
- 6.1.2. Chemical
- 6.1.3. Other End-user Industries
- 6.1. Market Analysis, Insights and Forecast - by End-user Industry
- 7. Burkina Faso Africa Sodium Cyanide Industry Analysis, Insights and Forecast, 2019-2031
- 7.1. Market Analysis, Insights and Forecast - by End-user Industry
- 7.1.1. Mining
- 7.1.2. Chemical
- 7.1.3. Other End-user Industries
- 7.1. Market Analysis, Insights and Forecast - by End-user Industry
- 8. Egypt Africa Sodium Cyanide Industry Analysis, Insights and Forecast, 2019-2031
- 8.1. Market Analysis, Insights and Forecast - by End-user Industry
- 8.1.1. Mining
- 8.1.2. Chemical
- 8.1.3. Other End-user Industries
- 8.1. Market Analysis, Insights and Forecast - by End-user Industry
- 9. Tanzania Africa Sodium Cyanide Industry Analysis, Insights and Forecast, 2019-2031
- 9.1. Market Analysis, Insights and Forecast - by End-user Industry
- 9.1.1. Mining
- 9.1.2. Chemical
- 9.1.3. Other End-user Industries
- 9.1. Market Analysis, Insights and Forecast - by End-user Industry
- 10. Zimbabwe Africa Sodium Cyanide Industry Analysis, Insights and Forecast, 2019-2031
- 10.1. Market Analysis, Insights and Forecast - by End-user Industry
- 10.1.1. Mining
- 10.1.2. Chemical
- 10.1.3. Other End-user Industries
- 10.1. Market Analysis, Insights and Forecast - by End-user Industry
- 11. Mali Africa Sodium Cyanide Industry Analysis, Insights and Forecast, 2019-2031
- 11.1. Market Analysis, Insights and Forecast - by End-user Industry
- 11.1.1. Mining
- 11.1.2. Chemical
- 11.1.3. Other End-user Industries
- 11.1. Market Analysis, Insights and Forecast - by End-user Industry
- 12. Democratic Republic of Congo Africa Sodium Cyanide Industry Analysis, Insights and Forecast, 2019-2031
- 12.1. Market Analysis, Insights and Forecast - by End-user Industry
- 12.1.1. Mining
- 12.1.2. Chemical
- 12.1.3. Other End-user Industries
- 12.1. Market Analysis, Insights and Forecast - by End-user Industry
- 13. Sudan Africa Sodium Cyanide Industry Analysis, Insights and Forecast, 2019-2031
- 13.1. Market Analysis, Insights and Forecast - by End-user Industry
- 13.1.1. Mining
- 13.1.2. Chemical
- 13.1.3. Other End-user Industries
- 13.1. Market Analysis, Insights and Forecast - by End-user Industry
- 14. Guinea Africa Sodium Cyanide Industry Analysis, Insights and Forecast, 2019-2031
- 14.1. Market Analysis, Insights and Forecast - by End-user Industry
- 14.1.1. Mining
- 14.1.2. Chemical
- 14.1.3. Other End-user Industries
- 14.1. Market Analysis, Insights and Forecast - by End-user Industry
- 15. South Africa Africa Sodium Cyanide Industry Analysis, Insights and Forecast, 2019-2031
- 15.1. Market Analysis, Insights and Forecast - by End-user Industry
- 15.1.1. Mining
- 15.1.2. Chemical
- 15.1.3. Other End-user Industries
- 15.1. Market Analysis, Insights and Forecast - by End-user Industry
- 16. Rest of Africa Africa Sodium Cyanide Industry Analysis, Insights and Forecast, 2019-2031
- 16.1. Market Analysis, Insights and Forecast - by End-user Industry
- 16.1.1. Mining
- 16.1.2. Chemical
- 16.1.3. Other End-user Industries
- 16.1. Market Analysis, Insights and Forecast - by End-user Industry
- 17. South Africa Africa Sodium Cyanide Industry Analysis, Insights and Forecast, 2019-2031
- 18. Sudan Africa Sodium Cyanide Industry Analysis, Insights and Forecast, 2019-2031
- 19. Uganda Africa Sodium Cyanide Industry Analysis, Insights and Forecast, 2019-2031
- 20. Tanzania Africa Sodium Cyanide Industry Analysis, Insights and Forecast, 2019-2031
- 21. Kenya Africa Sodium Cyanide Industry Analysis, Insights and Forecast, 2019-2031
- 22. Rest of Africa Africa Sodium Cyanide Industry Analysis, Insights and Forecast, 2019-2031
- 23. Competitive Analysis
- 23.1. Market Share Analysis 2024
- 23.2. Company Profiles
- 23.2.1 Honeywell International Inc
- 23.2.1.1. Overview
- 23.2.1.2. Products
- 23.2.1.3. SWOT Analysis
- 23.2.1.4. Recent Developments
- 23.2.1.5. Financials (Based on Availability)
- 23.2.2 TAEKWANG INDUSTRIAL CO LTD
- 23.2.2.1. Overview
- 23.2.2.2. Products
- 23.2.2.3. SWOT Analysis
- 23.2.2.4. Recent Developments
- 23.2.2.5. Financials (Based on Availability)
- 23.2.3 Australian Gold Reagents Pty Ltd
- 23.2.3.1. Overview
- 23.2.3.2. Products
- 23.2.3.3. SWOT Analysis
- 23.2.3.4. Recent Developments
- 23.2.3.5. Financials (Based on Availability)
- 23.2.4 Evonik Industries AG
- 23.2.4.1. Overview
- 23.2.4.2. Products
- 23.2.4.3. SWOT Analysis
- 23.2.4.4. Recent Developments
- 23.2.4.5. Financials (Based on Availability)
- 23.2.5 The Chemours Company
- 23.2.5.1. Overview
- 23.2.5.2. Products
- 23.2.5.3. SWOT Analysis
- 23.2.5.4. Recent Developments
- 23.2.5.5. Financials (Based on Availability)
- 23.2.6 Sasol
- 23.2.6.1. Overview
- 23.2.6.2. Products
- 23.2.6.3. SWOT Analysis
- 23.2.6.4. Recent Developments
- 23.2.6.5. Financials (Based on Availability)
- 23.2.7 HeBei ChengXin
- 23.2.7.1. Overview
- 23.2.7.2. Products
- 23.2.7.3. SWOT Analysis
- 23.2.7.4. Recent Developments
- 23.2.7.5. Financials (Based on Availability)
- 23.2.8 TSPC
- 23.2.8.1. Overview
- 23.2.8.2. Products
- 23.2.8.3. SWOT Analysis
- 23.2.8.4. Recent Developments
- 23.2.8.5. Financials (Based on Availability)
- 23.2.9 Orica Limited
- 23.2.9.1. Overview
- 23.2.9.2. Products
- 23.2.9.3. SWOT Analysis
- 23.2.9.4. Recent Developments
- 23.2.9.5. Financials (Based on Availability)
- 23.2.1 Honeywell International Inc
List of Figures
- Figure 1: Africa Sodium Cyanide Industry Revenue Breakdown (Million, %) by Product 2024 & 2032
- Figure 2: Africa Sodium Cyanide Industry Share (%) by Company 2024
List of Tables
- Table 1: Africa Sodium Cyanide Industry Revenue Million Forecast, by Region 2019 & 2032
- Table 2: Africa Sodium Cyanide Industry Volume K Tons Forecast, by Region 2019 & 2032
- Table 3: Africa Sodium Cyanide Industry Revenue Million Forecast, by End-user Industry 2019 & 2032
- Table 4: Africa Sodium Cyanide Industry Volume K Tons Forecast, by End-user Industry 2019 & 2032
- Table 5: Africa Sodium Cyanide Industry Revenue Million Forecast, by Region 2019 & 2032
- Table 6: Africa Sodium Cyanide Industry Volume K Tons Forecast, by Region 2019 & 2032
- Table 7: Africa Sodium Cyanide Industry Revenue Million Forecast, by Country 2019 & 2032
- Table 8: Africa Sodium Cyanide Industry Volume K Tons Forecast, by Country 2019 & 2032
- Table 9: South Africa Africa Sodium Cyanide Industry Revenue (Million) Forecast, by Application 2019 & 2032
- Table 10: South Africa Africa Sodium Cyanide Industry Volume (K Tons) Forecast, by Application 2019 & 2032
- Table 11: Sudan Africa Sodium Cyanide Industry Revenue (Million) Forecast, by Application 2019 & 2032
- Table 12: Sudan Africa Sodium Cyanide Industry Volume (K Tons) Forecast, by Application 2019 & 2032
- Table 13: Uganda Africa Sodium Cyanide Industry Revenue (Million) Forecast, by Application 2019 & 2032
- Table 14: Uganda Africa Sodium Cyanide Industry Volume (K Tons) Forecast, by Application 2019 & 2032
- Table 15: Tanzania Africa Sodium Cyanide Industry Revenue (Million) Forecast, by Application 2019 & 2032
- Table 16: Tanzania Africa Sodium Cyanide Industry Volume (K Tons) Forecast, by Application 2019 & 2032
- Table 17: Kenya Africa Sodium Cyanide Industry Revenue (Million) Forecast, by Application 2019 & 2032
- Table 18: Kenya Africa Sodium Cyanide Industry Volume (K Tons) Forecast, by Application 2019 & 2032
- Table 19: Rest of Africa Africa Sodium Cyanide Industry Revenue (Million) Forecast, by Application 2019 & 2032
- Table 20: Rest of Africa Africa Sodium Cyanide Industry Volume (K Tons) Forecast, by Application 2019 & 2032
- Table 21: Africa Sodium Cyanide Industry Revenue Million Forecast, by End-user Industry 2019 & 2032
- Table 22: Africa Sodium Cyanide Industry Volume K Tons Forecast, by End-user Industry 2019 & 2032
- Table 23: Africa Sodium Cyanide Industry Revenue Million Forecast, by Country 2019 & 2032
- Table 24: Africa Sodium Cyanide Industry Volume K Tons Forecast, by Country 2019 & 2032
- Table 25: Africa Sodium Cyanide Industry Revenue Million Forecast, by End-user Industry 2019 & 2032
- Table 26: Africa Sodium Cyanide Industry Volume K Tons Forecast, by End-user Industry 2019 & 2032
- Table 27: Africa Sodium Cyanide Industry Revenue Million Forecast, by Country 2019 & 2032
- Table 28: Africa Sodium Cyanide Industry Volume K Tons Forecast, by Country 2019 & 2032
- Table 29: Africa Sodium Cyanide Industry Revenue Million Forecast, by End-user Industry 2019 & 2032
- Table 30: Africa Sodium Cyanide Industry Volume K Tons Forecast, by End-user Industry 2019 & 2032
- Table 31: Africa Sodium Cyanide Industry Revenue Million Forecast, by Country 2019 & 2032
- Table 32: Africa Sodium Cyanide Industry Volume K Tons Forecast, by Country 2019 & 2032
- Table 33: Africa Sodium Cyanide Industry Revenue Million Forecast, by End-user Industry 2019 & 2032
- Table 34: Africa Sodium Cyanide Industry Volume K Tons Forecast, by End-user Industry 2019 & 2032
- Table 35: Africa Sodium Cyanide Industry Revenue Million Forecast, by Country 2019 & 2032
- Table 36: Africa Sodium Cyanide Industry Volume K Tons Forecast, by Country 2019 & 2032
- Table 37: Africa Sodium Cyanide Industry Revenue Million Forecast, by End-user Industry 2019 & 2032
- Table 38: Africa Sodium Cyanide Industry Volume K Tons Forecast, by End-user Industry 2019 & 2032
- Table 39: Africa Sodium Cyanide Industry Revenue Million Forecast, by Country 2019 & 2032
- Table 40: Africa Sodium Cyanide Industry Volume K Tons Forecast, by Country 2019 & 2032
- Table 41: Africa Sodium Cyanide Industry Revenue Million Forecast, by End-user Industry 2019 & 2032
- Table 42: Africa Sodium Cyanide Industry Volume K Tons Forecast, by End-user Industry 2019 & 2032
- Table 43: Africa Sodium Cyanide Industry Revenue Million Forecast, by Country 2019 & 2032
- Table 44: Africa Sodium Cyanide Industry Volume K Tons Forecast, by Country 2019 & 2032
- Table 45: Africa Sodium Cyanide Industry Revenue Million Forecast, by End-user Industry 2019 & 2032
- Table 46: Africa Sodium Cyanide Industry Volume K Tons Forecast, by End-user Industry 2019 & 2032
- Table 47: Africa Sodium Cyanide Industry Revenue Million Forecast, by Country 2019 & 2032
- Table 48: Africa Sodium Cyanide Industry Volume K Tons Forecast, by Country 2019 & 2032
- Table 49: Africa Sodium Cyanide Industry Revenue Million Forecast, by End-user Industry 2019 & 2032
- Table 50: Africa Sodium Cyanide Industry Volume K Tons Forecast, by End-user Industry 2019 & 2032
- Table 51: Africa Sodium Cyanide Industry Revenue Million Forecast, by Country 2019 & 2032
- Table 52: Africa Sodium Cyanide Industry Volume K Tons Forecast, by Country 2019 & 2032
- Table 53: Africa Sodium Cyanide Industry Revenue Million Forecast, by End-user Industry 2019 & 2032
- Table 54: Africa Sodium Cyanide Industry Volume K Tons Forecast, by End-user Industry 2019 & 2032
- Table 55: Africa Sodium Cyanide Industry Revenue Million Forecast, by Country 2019 & 2032
- Table 56: Africa Sodium Cyanide Industry Volume K Tons Forecast, by Country 2019 & 2032
- Table 57: Africa Sodium Cyanide Industry Revenue Million Forecast, by End-user Industry 2019 & 2032
- Table 58: Africa Sodium Cyanide Industry Volume K Tons Forecast, by End-user Industry 2019 & 2032
- Table 59: Africa Sodium Cyanide Industry Revenue Million Forecast, by Country 2019 & 2032
- Table 60: Africa Sodium Cyanide Industry Volume K Tons Forecast, by Country 2019 & 2032
- Table 61: Africa Sodium Cyanide Industry Revenue Million Forecast, by End-user Industry 2019 & 2032
- Table 62: Africa Sodium Cyanide Industry Volume K Tons Forecast, by End-user Industry 2019 & 2032
- Table 63: Africa Sodium Cyanide Industry Revenue Million Forecast, by Country 2019 & 2032
- Table 64: Africa Sodium Cyanide Industry Volume K Tons Forecast, by Country 2019 & 2032
Frequently Asked Questions
1. What is the projected Compound Annual Growth Rate (CAGR) of the Africa Sodium Cyanide Industry?
The projected CAGR is approximately > 3.00%.
2. Which companies are prominent players in the Africa Sodium Cyanide Industry?
Key companies in the market include Honeywell International Inc, TAEKWANG INDUSTRIAL CO LTD, Australian Gold Reagents Pty Ltd, Evonik Industries AG, The Chemours Company, Sasol, HeBei ChengXin, TSPC, Orica Limited.
3. What are the main segments of the Africa Sodium Cyanide Industry?
The market segments include End-user Industry.
4. Can you provide details about the market size?
The market size is estimated to be USD XX Million as of 2022.
5. What are some drivers contributing to market growth?
Increasing Demand from the Gold Mining Activities; Increasing Demand for Use in Chemical and Polymer Synthesis.
6. What are the notable trends driving market growth?
Increasing Demand from Mining Industry.
7. Are there any restraints impacting market growth?
Toxicity of Sodium Cyanide.
8. Can you provide examples of recent developments in the market?
January 2023: Shortages of sodium cyanide in Tanzania has hampered the country's large and medium sclae miners.
9. What pricing options are available for accessing the report?
Pricing options include single-user, multi-user, and enterprise licenses priced at USD 4750, USD 5250, and USD 8750 respectively.
10. Is the market size provided in terms of value or volume?
The market size is provided in terms of value, measured in Million and volume, measured in K Tons.
11. Are there any specific market keywords associated with the report?
Yes, the market keyword associated with the report is "Africa Sodium Cyanide Industry," which aids in identifying and referencing the specific market segment covered.
12. How do I determine which pricing option suits my needs best?
The pricing options vary based on user requirements and access needs. Individual users may opt for single-user licenses, while businesses requiring broader access may choose multi-user or enterprise licenses for cost-effective access to the report.
13. Are there any additional resources or data provided in the Africa Sodium Cyanide Industry report?
While the report offers comprehensive insights, it's advisable to review the specific contents or supplementary materials provided to ascertain if additional resources or data are available.
14. How can I stay updated on further developments or reports in the Africa Sodium Cyanide Industry?
To stay informed about further developments, trends, and reports in the Africa Sodium Cyanide Industry, consider subscribing to industry newsletters, following relevant companies and organizations, or regularly checking reputable industry news sources and publications.
Methodology
Step 1 - Identification of Relevant Samples Size from Population Database


Step 2 - Approaches for Defining Global Market Size (Value, Volume* & Price*)

Note*: In applicable scenarios
Step 3 - Data Sources
Primary Research
- Web Analytics
- Survey Reports
- Research Institute
- Latest Research Reports
- Opinion Leaders
Secondary Research
- Annual Reports
- White Paper
- Latest Press Release
- Industry Association
- Paid Database
- Investor Presentations

Step 4 - Data Triangulation
Involves using different sources of information in order to increase the validity of a study
These sources are likely to be stakeholders in a program - participants, other researchers, program staff, other community members, and so on.
Then we put all data in single framework & apply various statistical tools to find out the dynamic on the market.
During the analysis stage, feedback from the stakeholder groups would be compared to determine areas of agreement as well as areas of divergence
